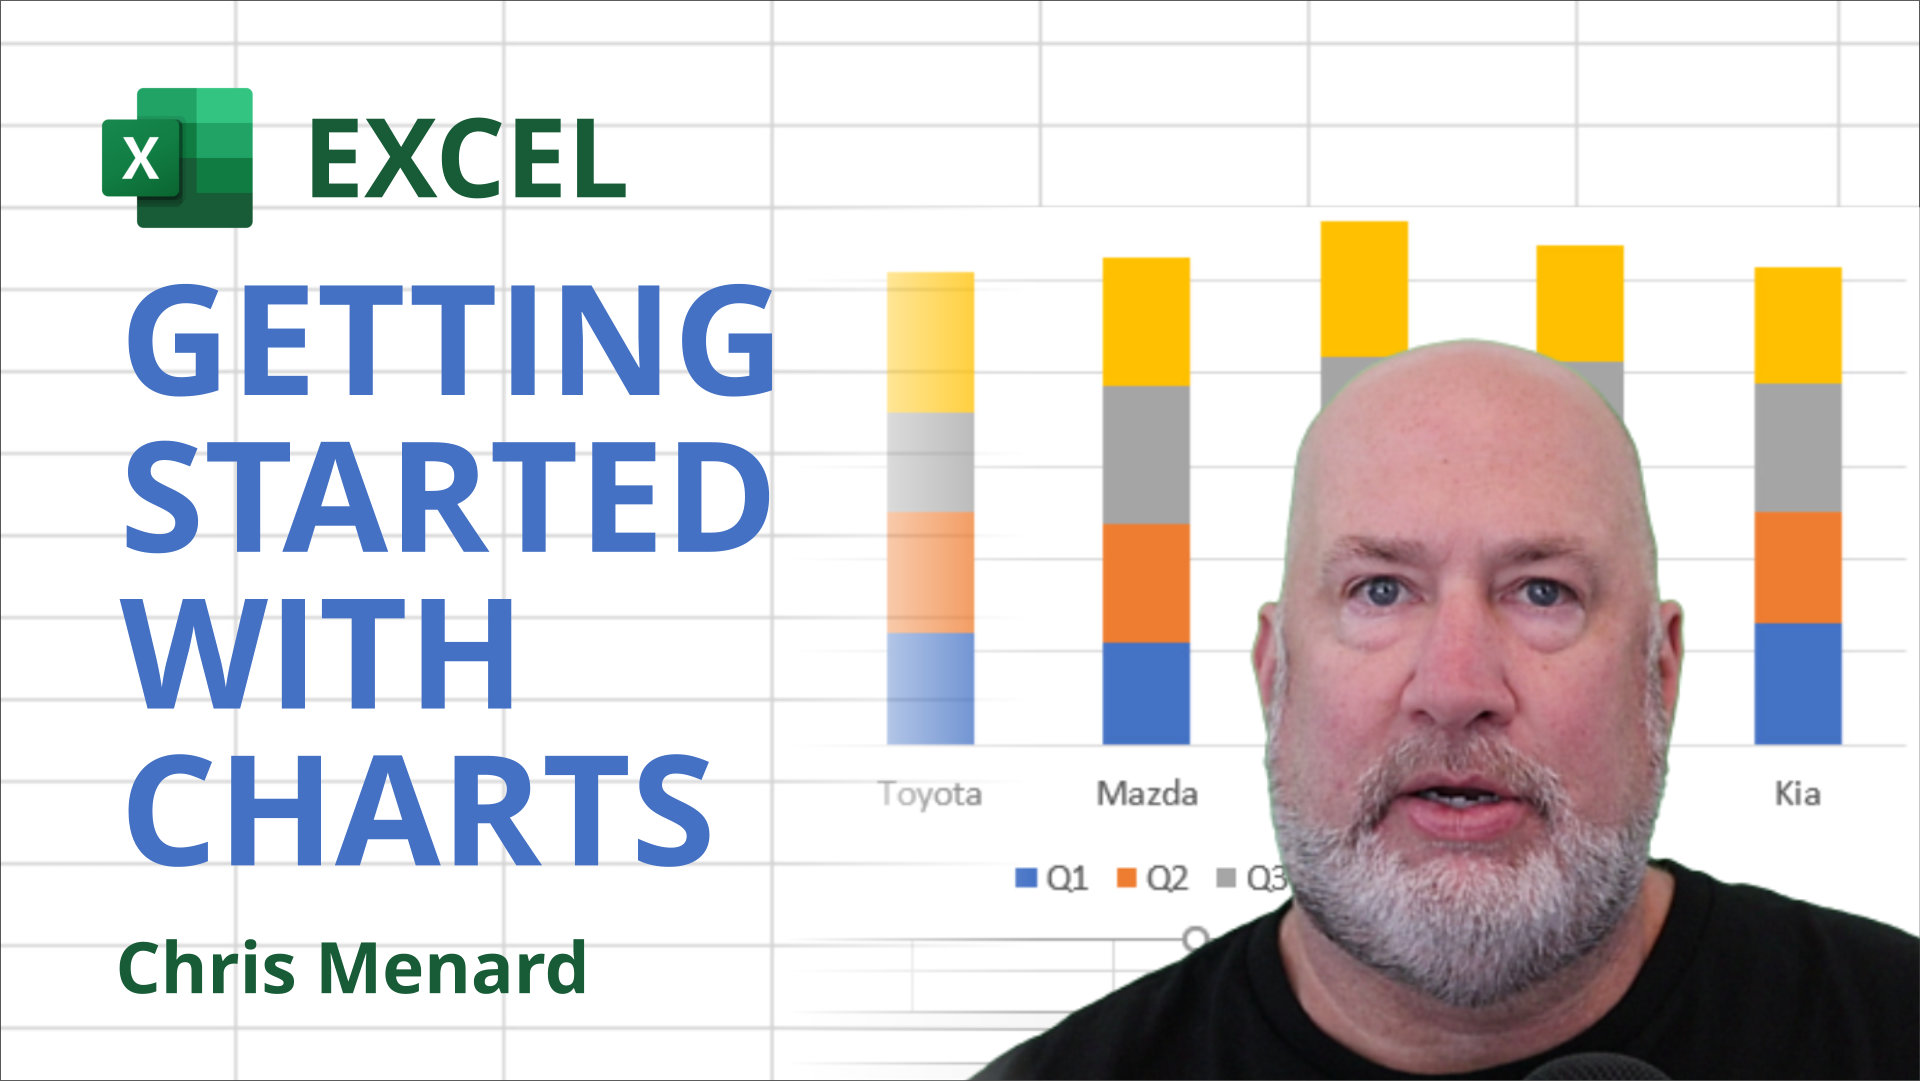
Three tips for getting started with Excel Charts
Posted by Chris Menard on 01/08/2021
Charts in Microsoft Excel are easy. This short video shows three tips for creating charts. I'll cover two keyboard shortcuts for making charts, using Recommend Charts, and creating charts using Quick Analysis.
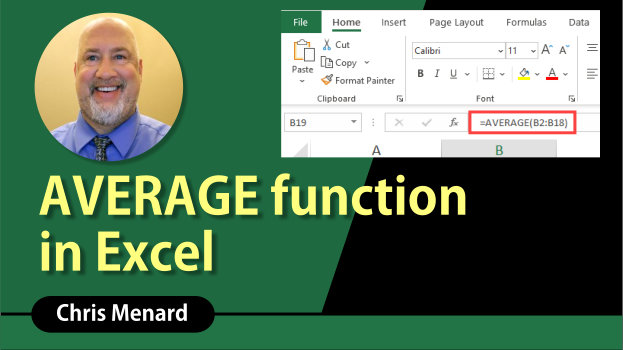
Average Function in Excel
Posted on 06/07/2020
The AVERAGE function is one of the most popular functions in Excel. This video shows how to use the Average function, handles zero values when using the Average function. Zero values vs. blank cells will give different results with Average. As a bonus, using the AverageIF function with zero values.
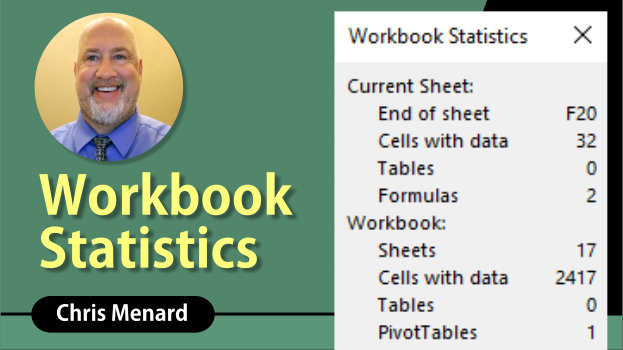
Workbook Statistics in Excel for Microsoft 365
Posted by Chris Menard on 05/09/2020
Excel for Microsoft 365 subscribers now have Workbook Statistics. Workbook Statistics is a window that shows a summary of the workbook statistics including the number of sheets, tables, formulas, charts, and pivottables.

Webinar on Excel Functions on 12/04/2018
Posted by Chris Menard on 12/03/2018
Webinar on Excel function on Tuesday, December 4, 2018. Functions covered will include trim, count, average, median, large, countblank, and many other functions.
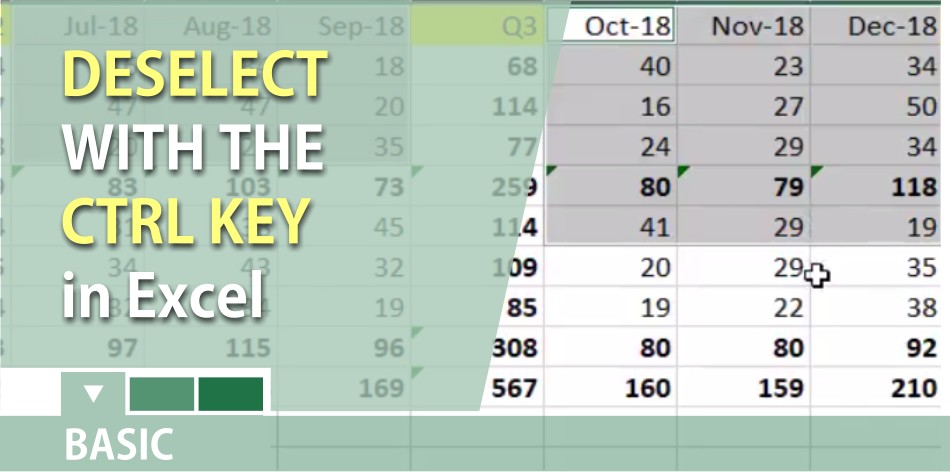
Deselect with the CTRL key in Excel
Posted by Chris Menard on 12/27/2017
The CTRL key is used to select non-adjacent ranges which is a handy feature for charts and summing ranges. You can now deselect with the CTRL key. Huge improvement in Excel.
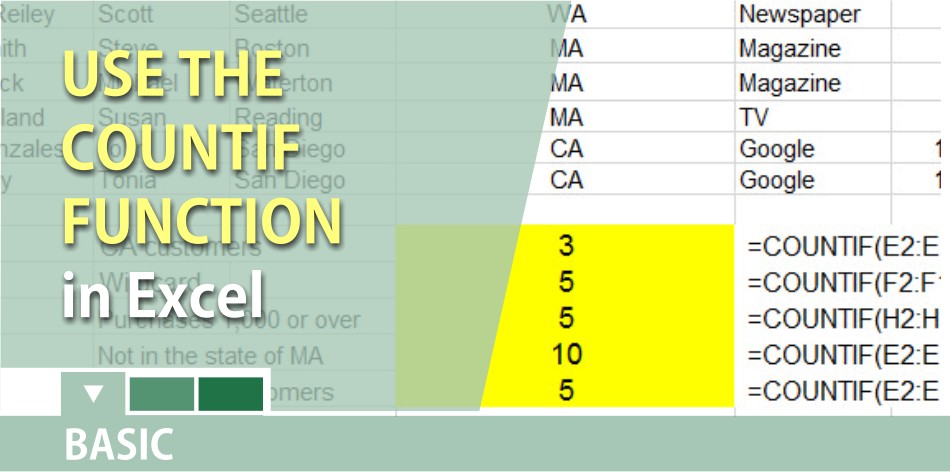
Use the COUNTIF function in Microsoft Excel
Posted by Chris Menard on 12/28/2016
The Countif function in Excel is one of the top 10 functions to know. You can use Countif for text, numbers, greater than, and other criteria.