Three tips for getting started with Excel Charts

Charts in Microsoft Excel are easy. This short video shows three tips for creating charts. I'll cover two keyboard shortcuts for making charts, using Recommend Charts, and creating charts using Quick Analysis.
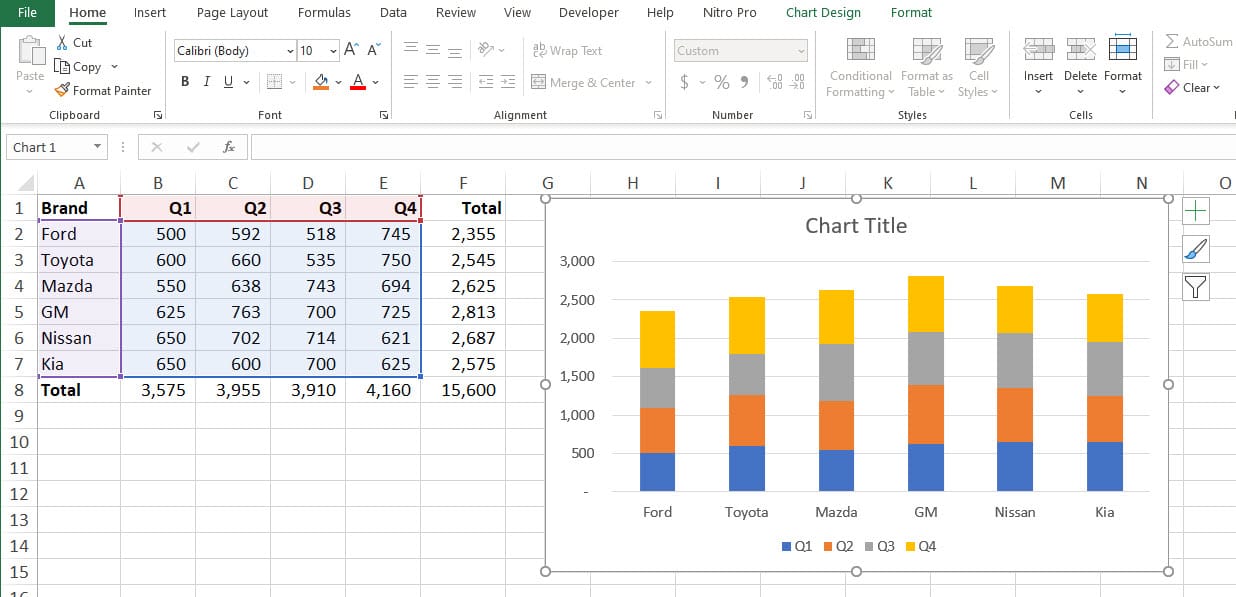
Tip # 1 - Use Keyboard Shortcuts to create Charts
Windows Keyboard shortcuts
- **F11** to create a chart on a new worksheet - **ALT + F1** to create a chart on the current worksheet
Mac Keyboard shortcuts
- **FN + F11** to create a chart on a new worksheet - **FN + ⌥ + F1** to create a chart on the current worksheet
_Note_: If these shortcuts don't work on the Mac, you must turn off the conflicting Mission Control keyboard shortcut on your Mac by going to System Settings > Keyboard > Shortcuts > Mission Control and disabliging Show Desktop \[F11\].
YouTube Video on Three tips for getting started with Excel Charts
Three tips for getting started with Excel Charts - YouTube
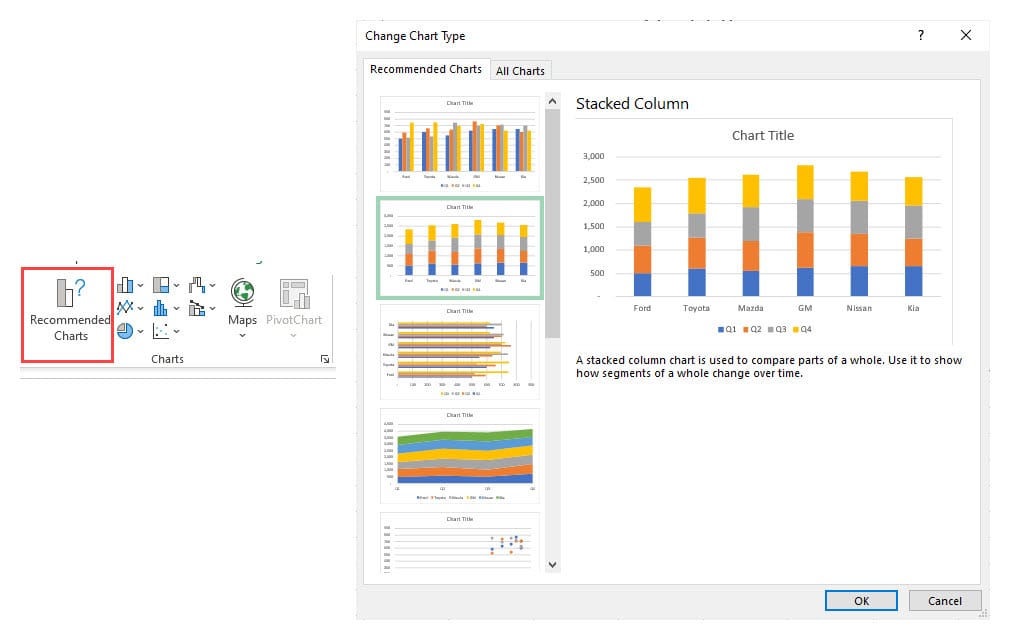
Tip # 2 - Use Recommend Charts
Steps to use recommended charts
1. Select the data to chart 2. Click the **insert** tab 3. Click **Recommended Charts -** screenshot above 4. Select a chart to preview the chart 5. Click **OK**
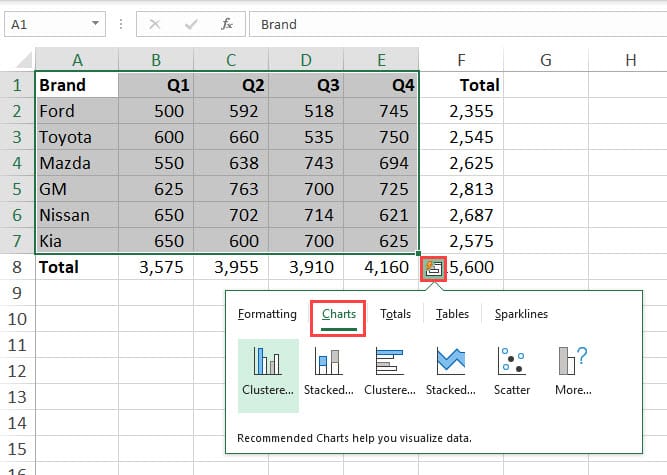
Tip # 3 - Use Quick Analysis to create a Chart
Steps to use Quick Analysis
1. Select the data to chart 2. Click the **Quick Analysis icon** 3. Click **Charts -** screenshot above 4. Mouse over the charts to preview 5. Click a chart to add to the worksheet