Calculate multiple results by using a data table in Excel.
One of Excel 2016's best features is Get and Transform data using the Power Query Editor on the Data tab. It changes crosstab data to flat data.
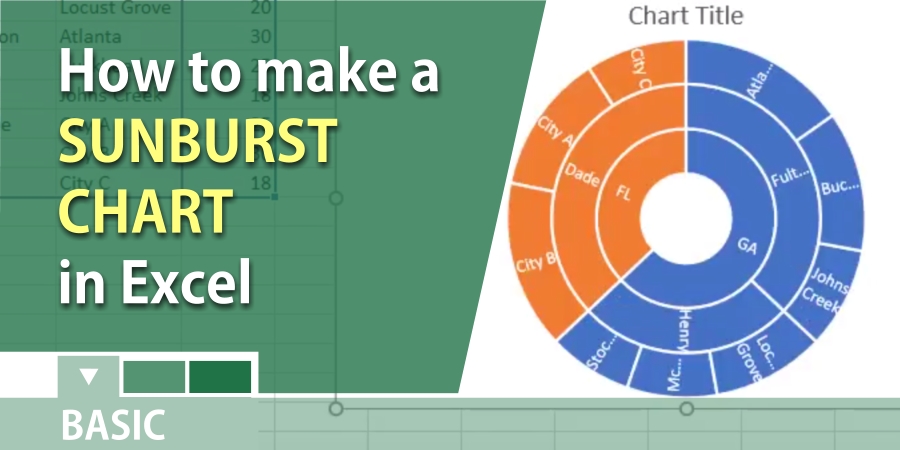
The sunburst chart or multi-level pie chart is ideal for displaying hierarchical data. This short tutorial shows you how to create one.
Need to group numbers in Excel? Shown are three methods for grouping numbers.
Insights in Excel is a new feature of Excel 2016 with an Office 365 subscription that give you fast, automated, insightful analysis of your data.
Excel’s PivotTables are great, but sometimes we get subtotals within subtotals and you want to lose only the 2nd subtotal.
Extracting email address from a text string in Excel can be tricky. I made a video demonstrating three methods of extracting the email addresses.
Create a break-even analysis with multiple products in Excel. Create a contribution margin income statement using a product mix.