Excel COPILOT Function: Advanced Prompts with Real Examples
Push the Excel COPILOT function with five advanced prompts on a real sales dataset — regional totals, ranking, category comparisons, and finding the top improver by dollars and by percentage — plus how to verify every answer.


The COPILOT function in Excel lets you ask detailed, plain-English questions about your data right inside a cell — and it answers in a second or two. I have covered this function before, but here I want to push it with some genuinely advanced prompts against a brand-new sales dataset and see how far it goes.
Below I walk through five prompts, from a simple regional total to finding the top improver by percentage across four quarters.
The sample file and every prompt I use are listed right in the worksheet, so you can rebuild this exercise yourself.
Three things to know before you start
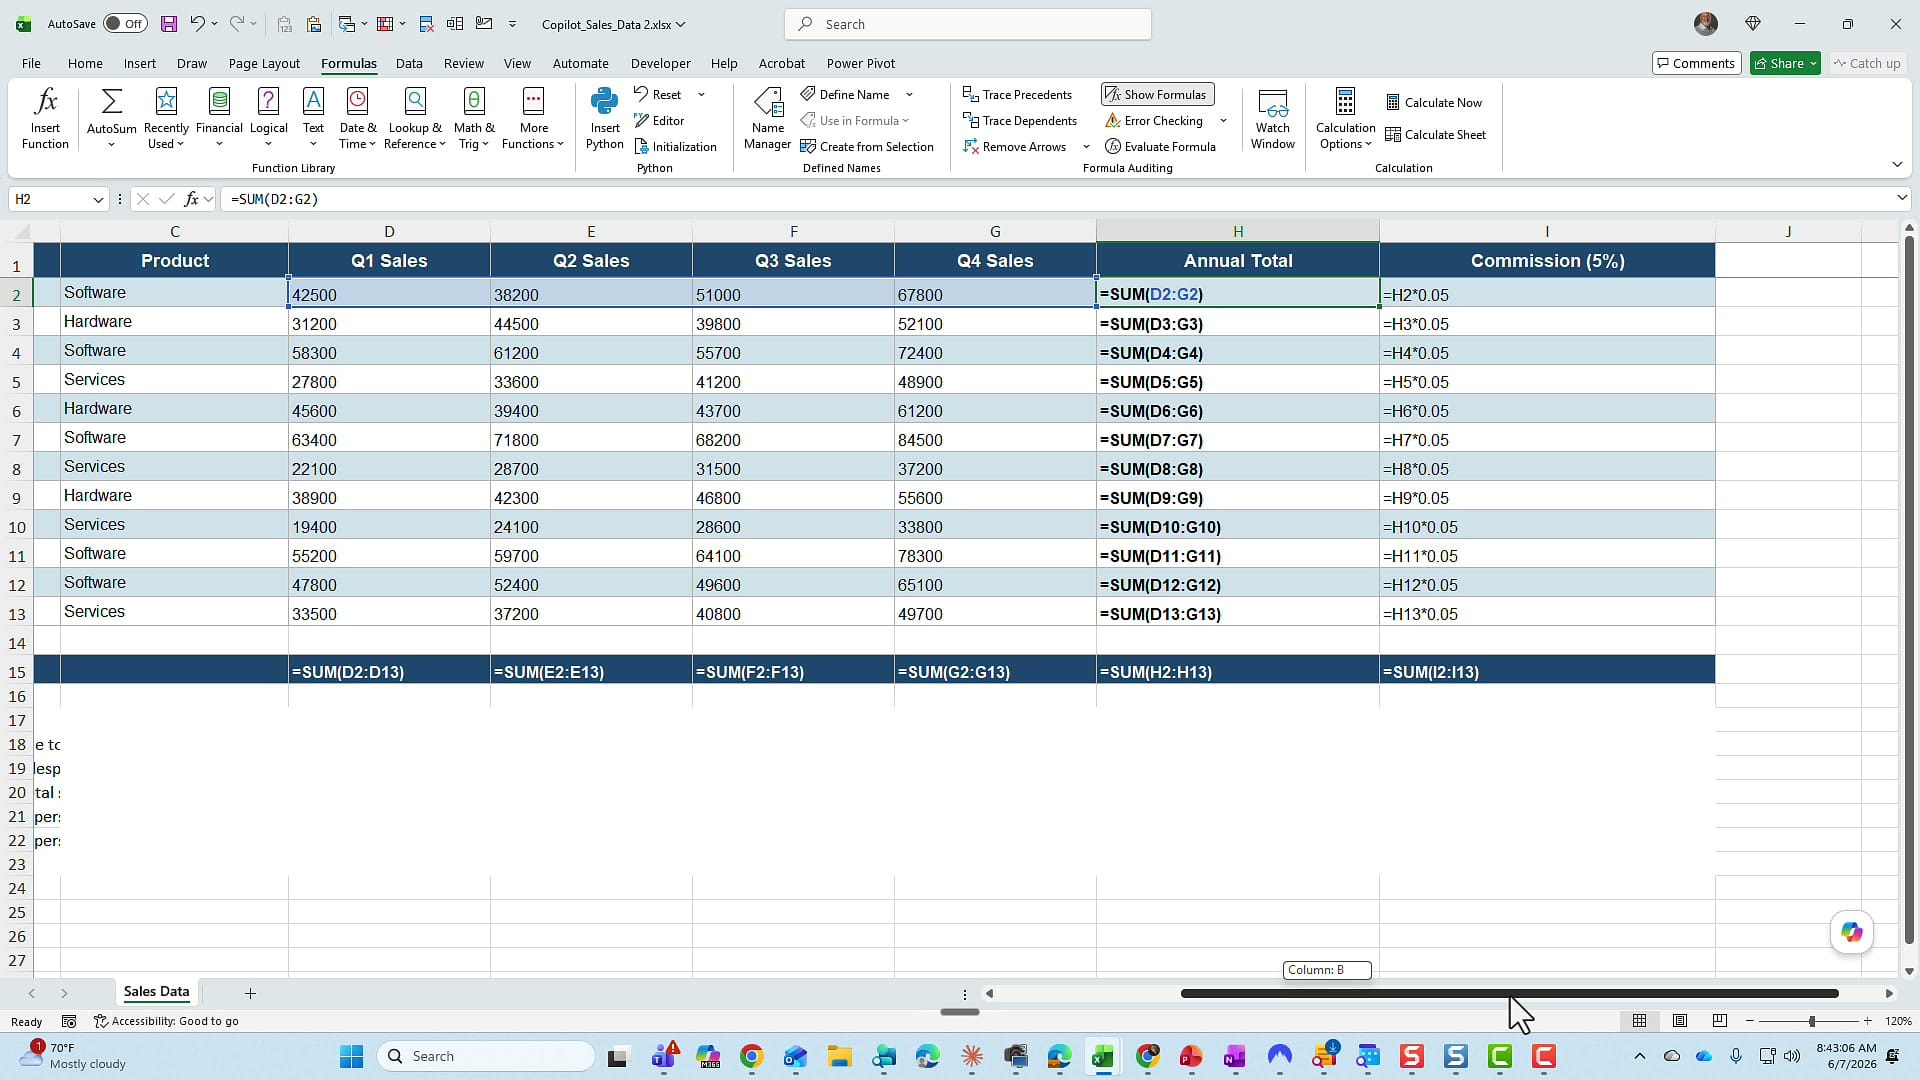
1. The sample data already contains formulas. If you go to the Formulas tab and click Show Formulas, you can see the Annual Total column uses the SUM function and the Commission column uses a percentage formula. Show Formulas is a toggle, so click it again to switch back to values. None of this is required for the COPILOT function to work — I am just pointing out what is under the hood.
2. The data is a range, not a table. In day-to-day work I would usually convert this to an Excel table, but for this demo I deliberately left it as a plain range so you can see the function works fine either way.
3. You need a paid Microsoft 365 Copilot license. The COPILOT function only works with a paid M365 Copilot (premium) license — the free Copilot Chat will not run it. If you are not sure which one you have, here is how to tell whether you have a paid Copilot license or the free Copilot Chat. A quick test: start typing =COPILOT in any cell — if it appears in the function list, you are good to go. It works on both Excel for the web and the desktop app.
How the COPILOT function works
The syntax is straightforward: =COPILOT("your prompt here", range). You type a natural-language question in quotes, then point it at the data you want analyzed. The result spills automatically — if the answer is a list, it fills down the cells below on its own. The biggest thing you will notice is speed: it is dramatically faster than clicking the Copilot icon and typing the same prompt into the side pane. That speed is exactly why I reach for the function instead. If you also want Excel to write traditional formulas for you, that is a different feature — I compare the two in Formula Completion vs the COPILOT function.
Prompt 1: Total sales by region
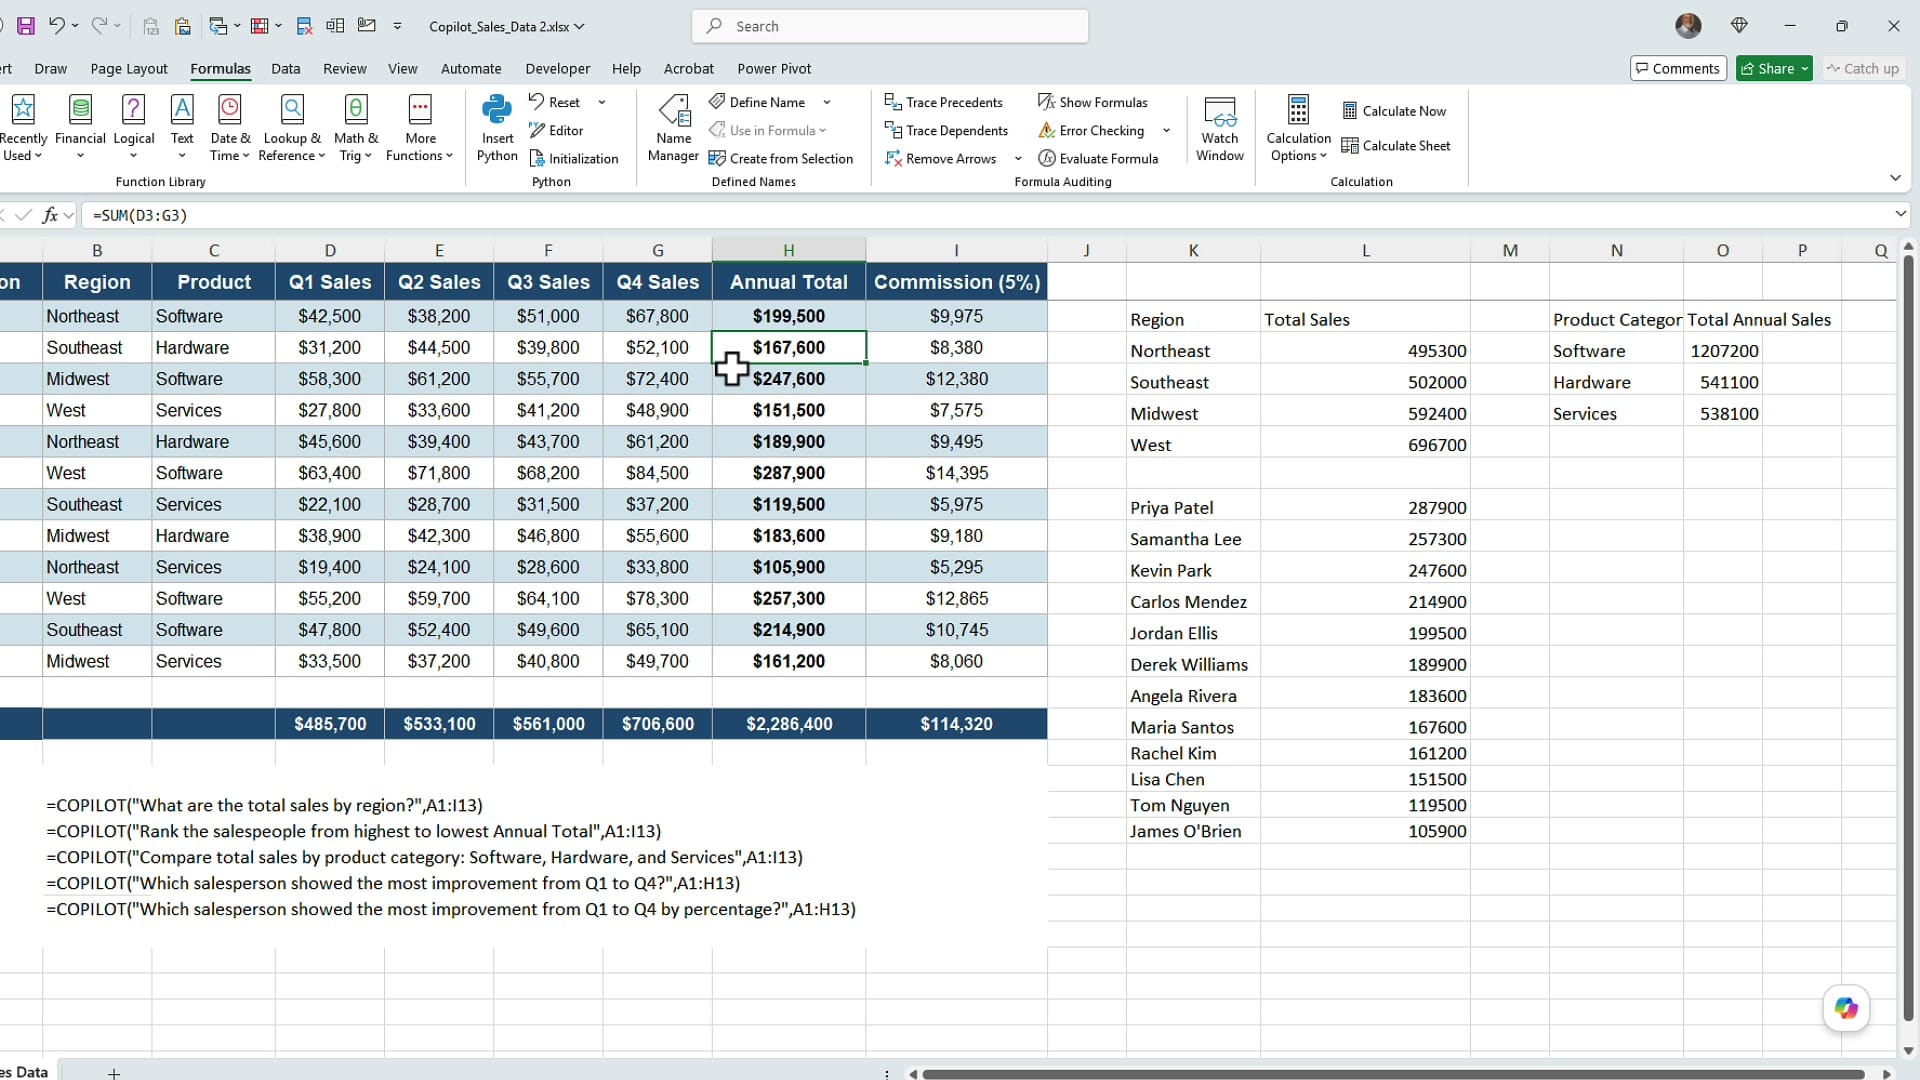
I put the first prompt in cell K2: =COPILOT("What are the total sales by region?", A1:I13). In a second the function returns each region with its total. Notice I am referencing the entire data range, A1:I13, so Copilot has all the context it needs.
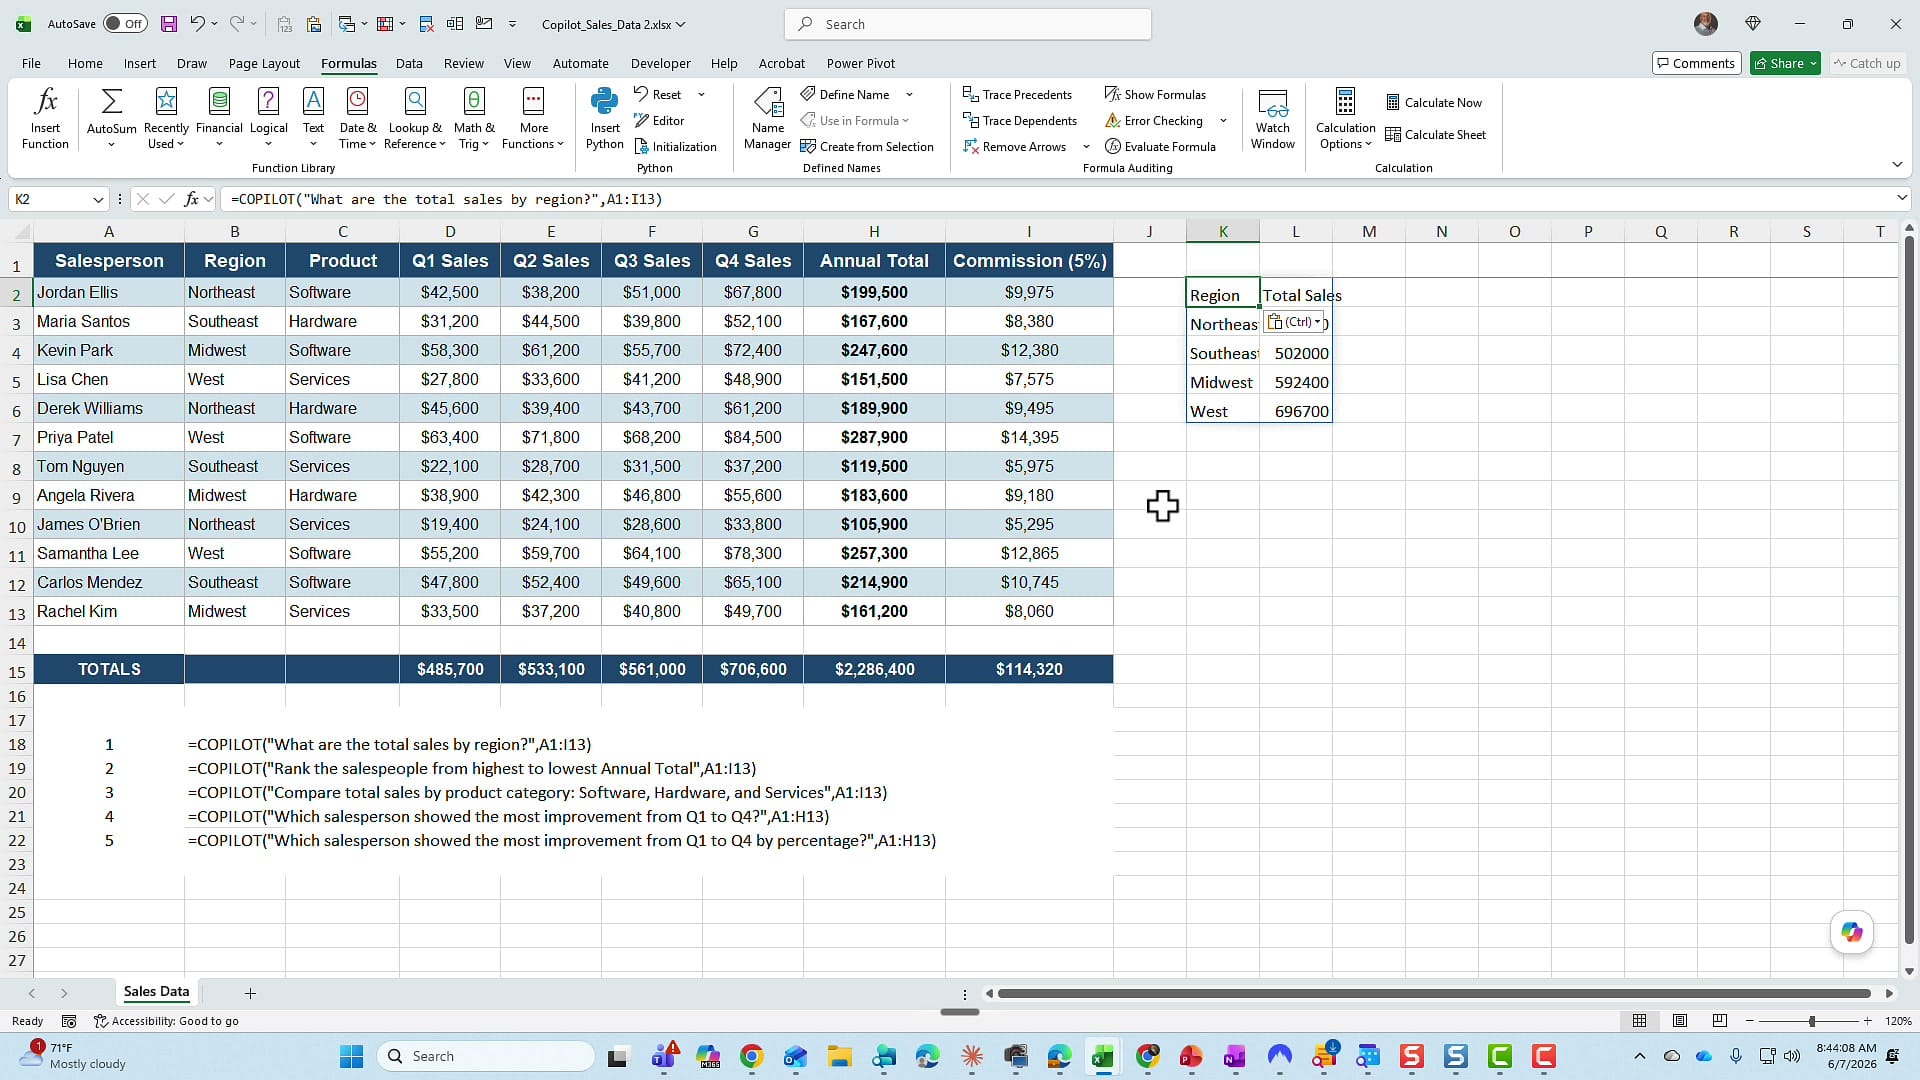
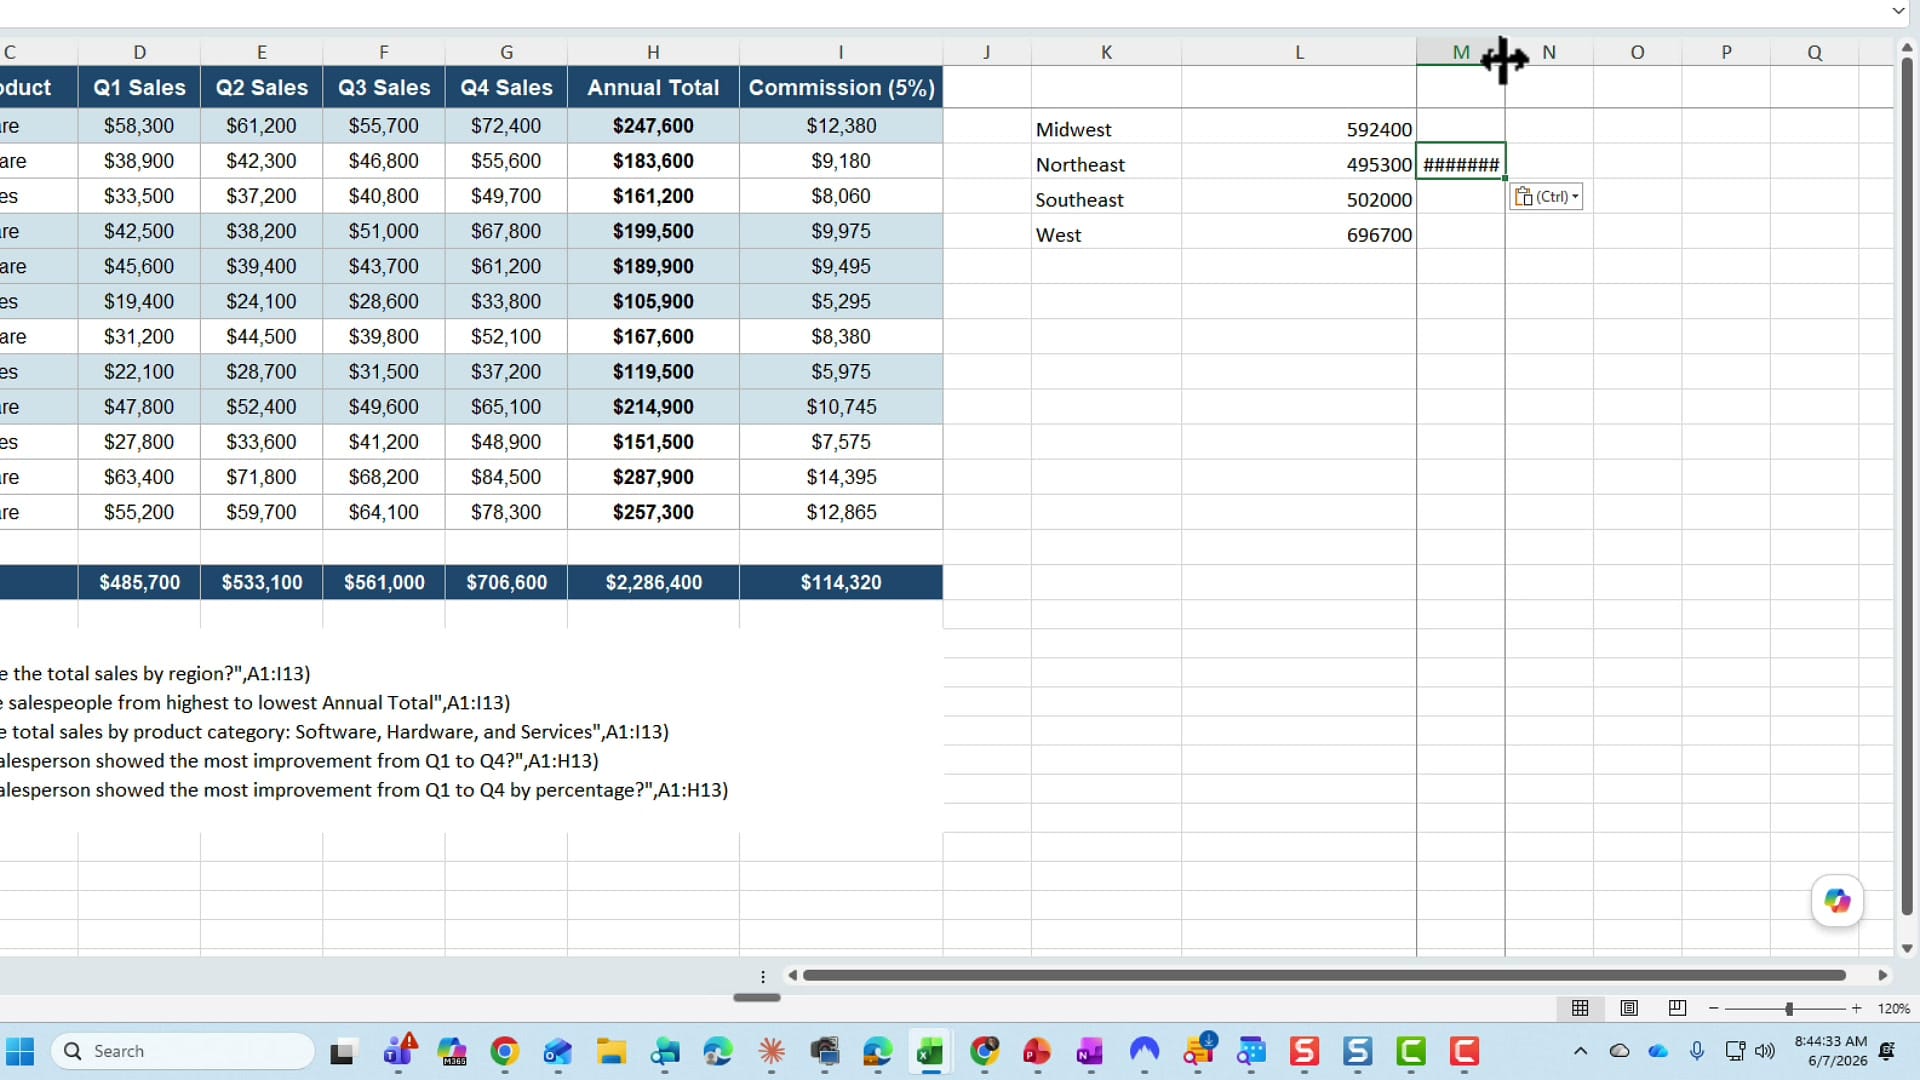
Never take an AI answer on faith — verify it. I selected the Northeast sales cells and checked the Sum in the status bar at the bottom of the window: 495,300, an exact match for what the function returned. Always confirm at least one value against your own numbers.
Prompt 2: Rank the salespeople from highest to lowest
Next prompt: =COPILOT("Rank the salespeople from highest to lowest Annual Total", A1:I13). The function returns the full roster sorted by annual total, top performer first. I could get the same answer by sorting the Annual Total column largest to smallest, but the function does it instantly without touching my source data — the original range stays exactly as it was.
Prompt 3: Compare totals by product category
Now I compare categories: =COPILOT("Compare total sales by product category: Software, Hardware, and Services", A1:I13). The function breaks the totals out by category — Software, Hardware, and Services — in one shot. To spot-check it, I held the Control key and clicked the Hardware cells so I did not have to sort anything; the status bar confirmed 541,100 for Hardware. If you want a deeper look at when a summary like this is better handled by a PivotTable, I cover that in PivotTable vs functions with Copilot in Excel.
Prompt 4: Who improved the most from Q1 to Q4?
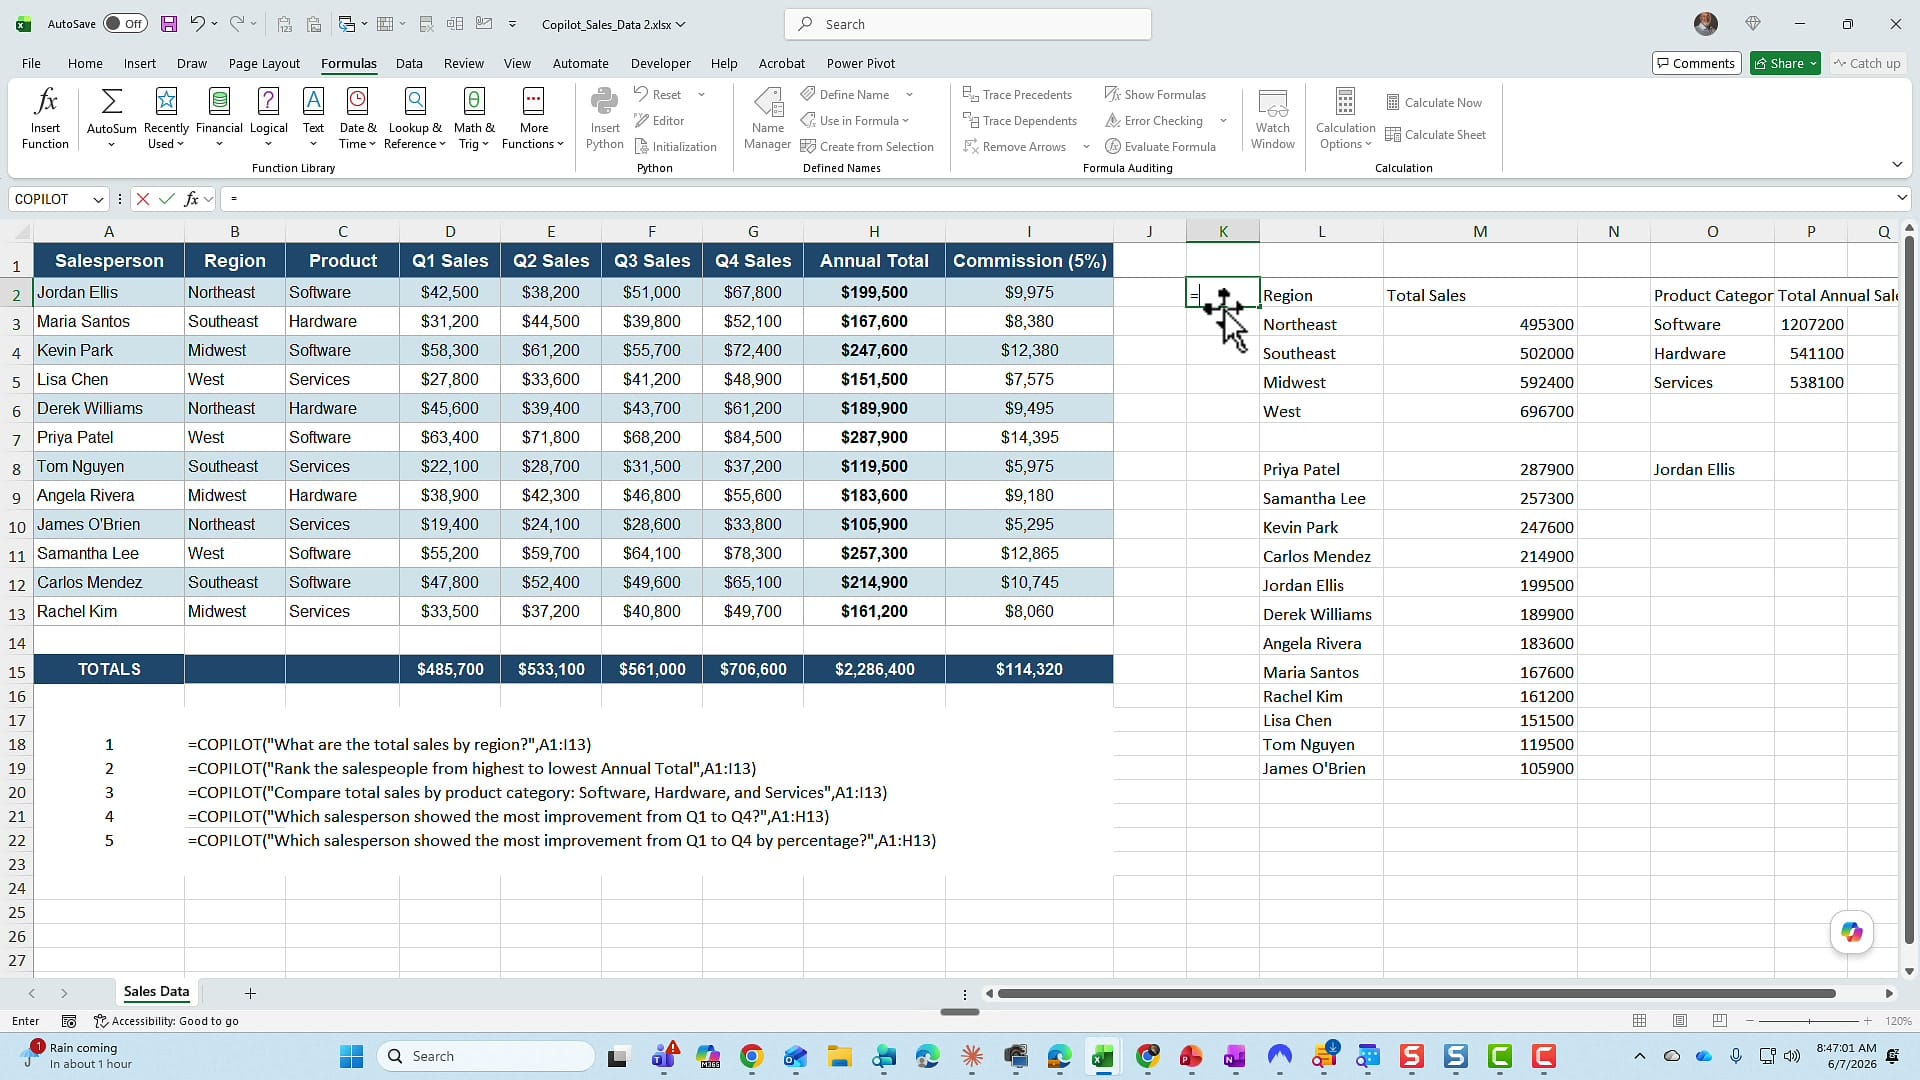
Here is where it gets advanced — and where I want to teach a lesson about writing prompts. I asked for a single person: =COPILOT("Which salesperson showed the most improvement from Q1 to Q4?", A1:H13). The function returned Jordan Ellis.
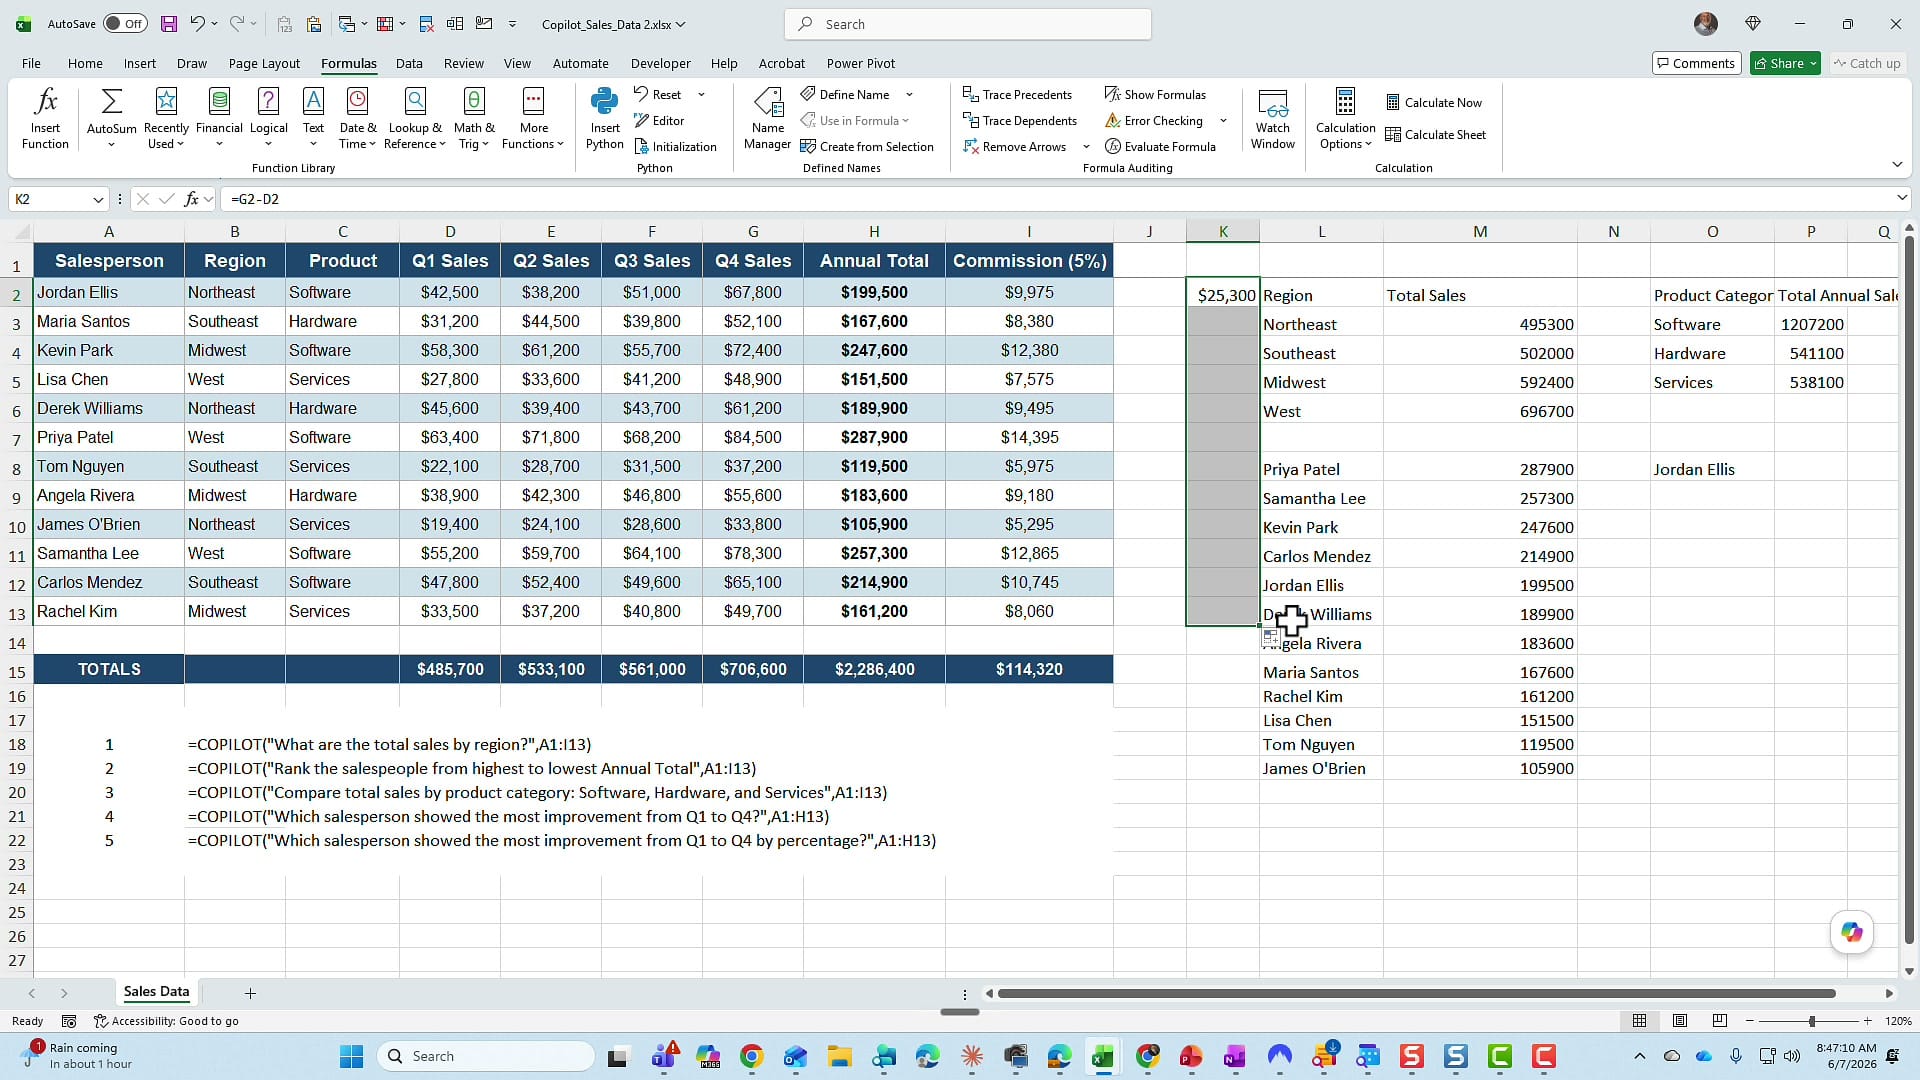
I want to be honest: that is not a well-written prompt. I never told Copilot whether I meant improvement in dollars or by percentage, and those can give different answers. Let me check the dollar version myself. For Jordan Ellis, Q4 minus Q1 comes to 25,300, which does look like the largest raw-dollar gain in the group.
The takeaway: be specific in your prompts. If you mean dollars, say dollars. If you mean percentage, say percentage. A vague prompt gives you a vague answer, and you will not know which interpretation the function used.
Prompt 5: Who improved the most by percentage?
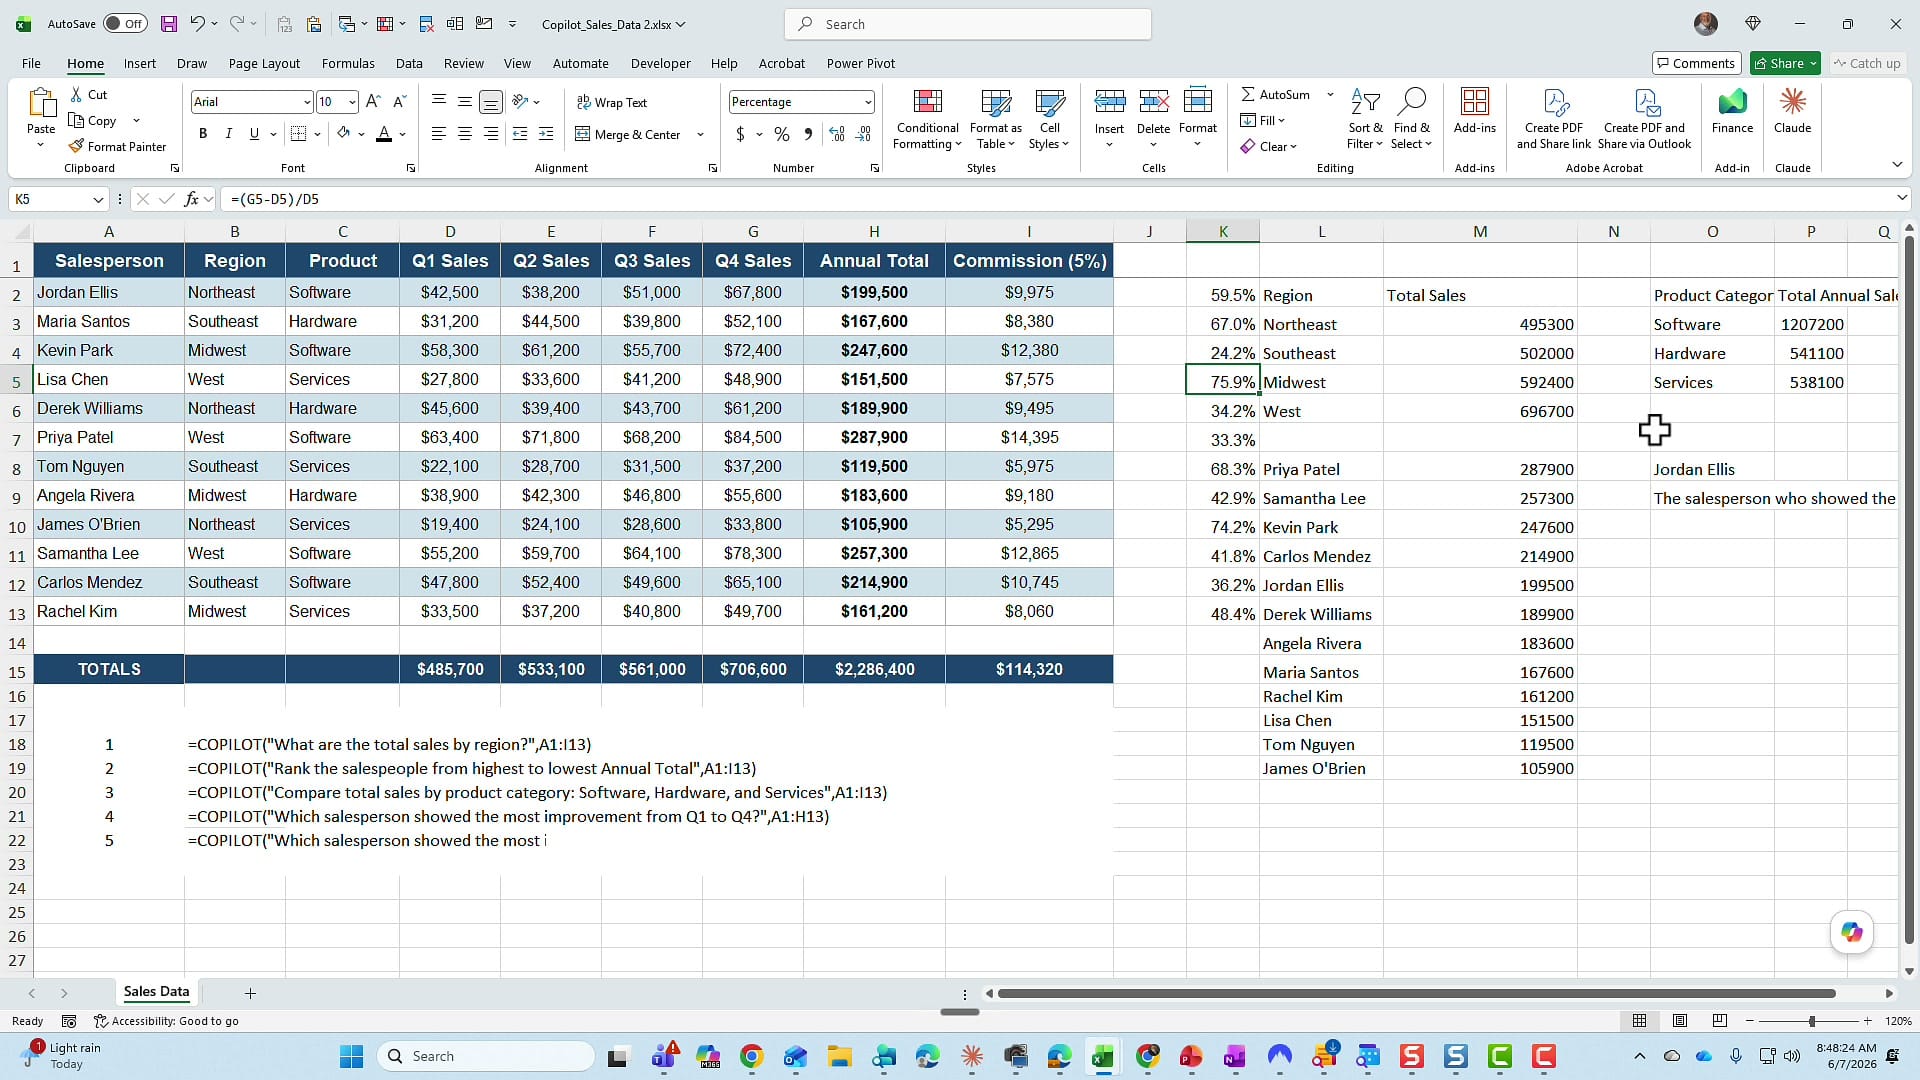
This time I was specific: =COPILOT("Which salesperson showed the most improvement from Q1 to Q4 by percentage?", A1:H13). The function came back with Lisa at 75.9%, a completely different answer than the dollar version — which is exactly the point. To verify, the percentage improvement is (Q4 minus Q1) divided by Q1. I dropped that formula in and pulled it down the column: Lisa's 75.9% is indeed the highest percentage gain, confirming the function.
Why I keep reaching for the COPILOT function
Two things stand out across all five prompts. First, the speed — the function answers almost instantly, far quicker than typing prompts into the Copilot side pane. Second, it never disturbs my source data; every answer spills into a fresh area while the original range stays untouched. The one rule I will repeat: always verify at least one value against your own calculation before you act on the result. The function is fast and impressive, but the COPILOT function is a tool, and the numbers are still yours to confirm.
If your data needs cleaning before you start analyzing it, the same function pairs well with Go To Special — I walk through that in fixing blanks with Go To Special and the COPILOT function.
Related guides