
Excel Copilot: Create Multiple Worksheets with One Prompt
Give Copilot in Excel one prompt and get two new worksheets: an office location summary with time zones and employee counts, plus a dashboard with data bars and a chart.


Most people use Copilot in Excel one request at a time: ask for a summary, wait, ask for a chart, wait, ask for formatting, wait. You don't have to work that way. Copilot can handle several tasks in a single prompt, including building more than one new worksheet for you.
In this example I give Copilot one prompt that asks for two new worksheets: an office location summary with time zones and employee counts, and a time zone dashboard with percentages, data bars, and a chart. It builds all of it in one pass.
What you need
This exercise uses Copilot inside Excel, so you need a Premium (paid) Microsoft 365 Copilot license. If you aren't sure which one you have, here is how to tell if you have a Microsoft 365 Copilot license or the free Copilot Chat.
The sample data: 700 employees
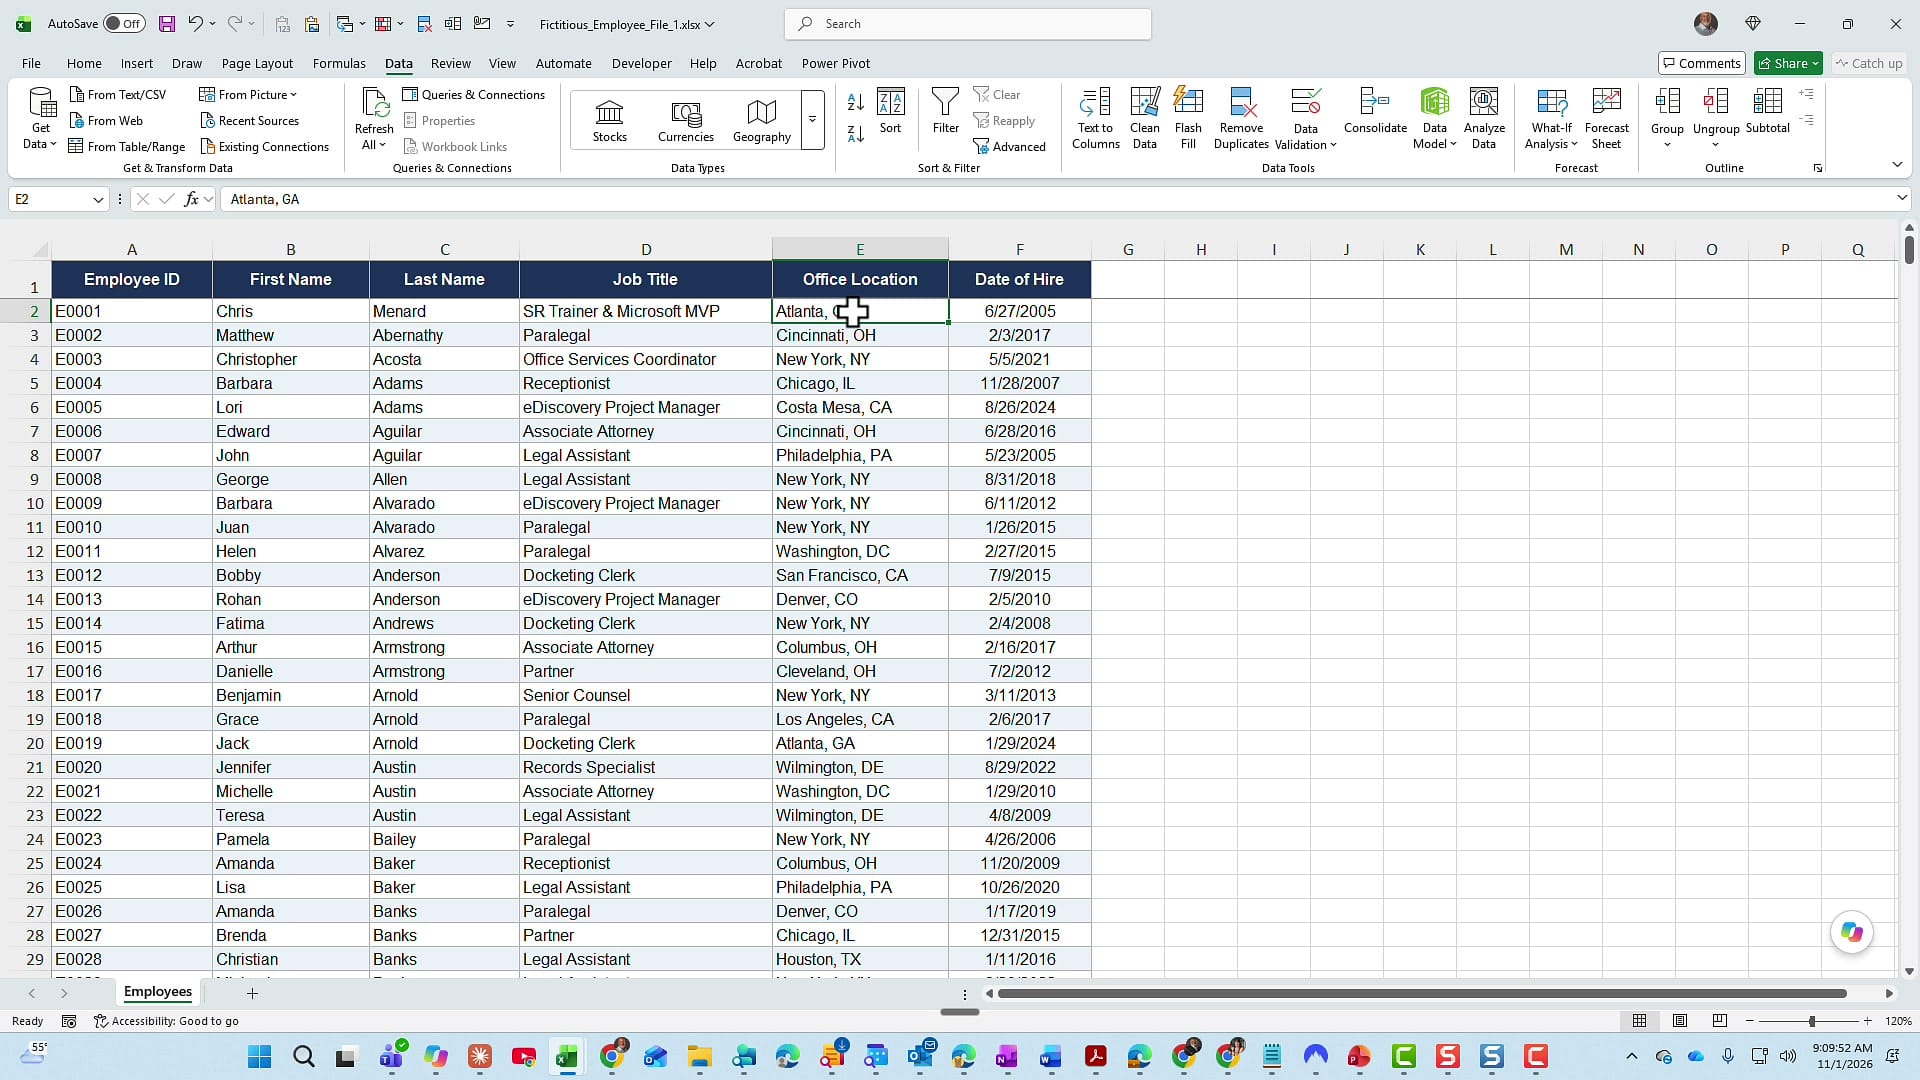
I'm working with a fictitious employee list on a worksheet named Employees. It has an Employee ID, first and last name, job title, office location, and date of hire. There are exactly 700 employees, spread across a bunch of office locations like Atlanta, Cincinnati, New York, Chicago, and Costa Mesa. Knowing the size of your data up front makes it easy to check Copilot's work later.
A local file and a plain range
Two details are worth pointing out before we start. First, this file is not saved in my OneDrive. It's a local file, and Copilot in Excel now works on local files. Second, my data is a regular range, not an Excel table. Copilot used to require a table, but Copilot now works without a table, so you can skip that step.
Open Copilot and ask for everything at once
Click the Copilot button wherever you have it. Mine is still in the bottom-right corner of the sheet. The pane opens with a "Let's get started" screen and a few suggestions, but I'm going to write my own request.
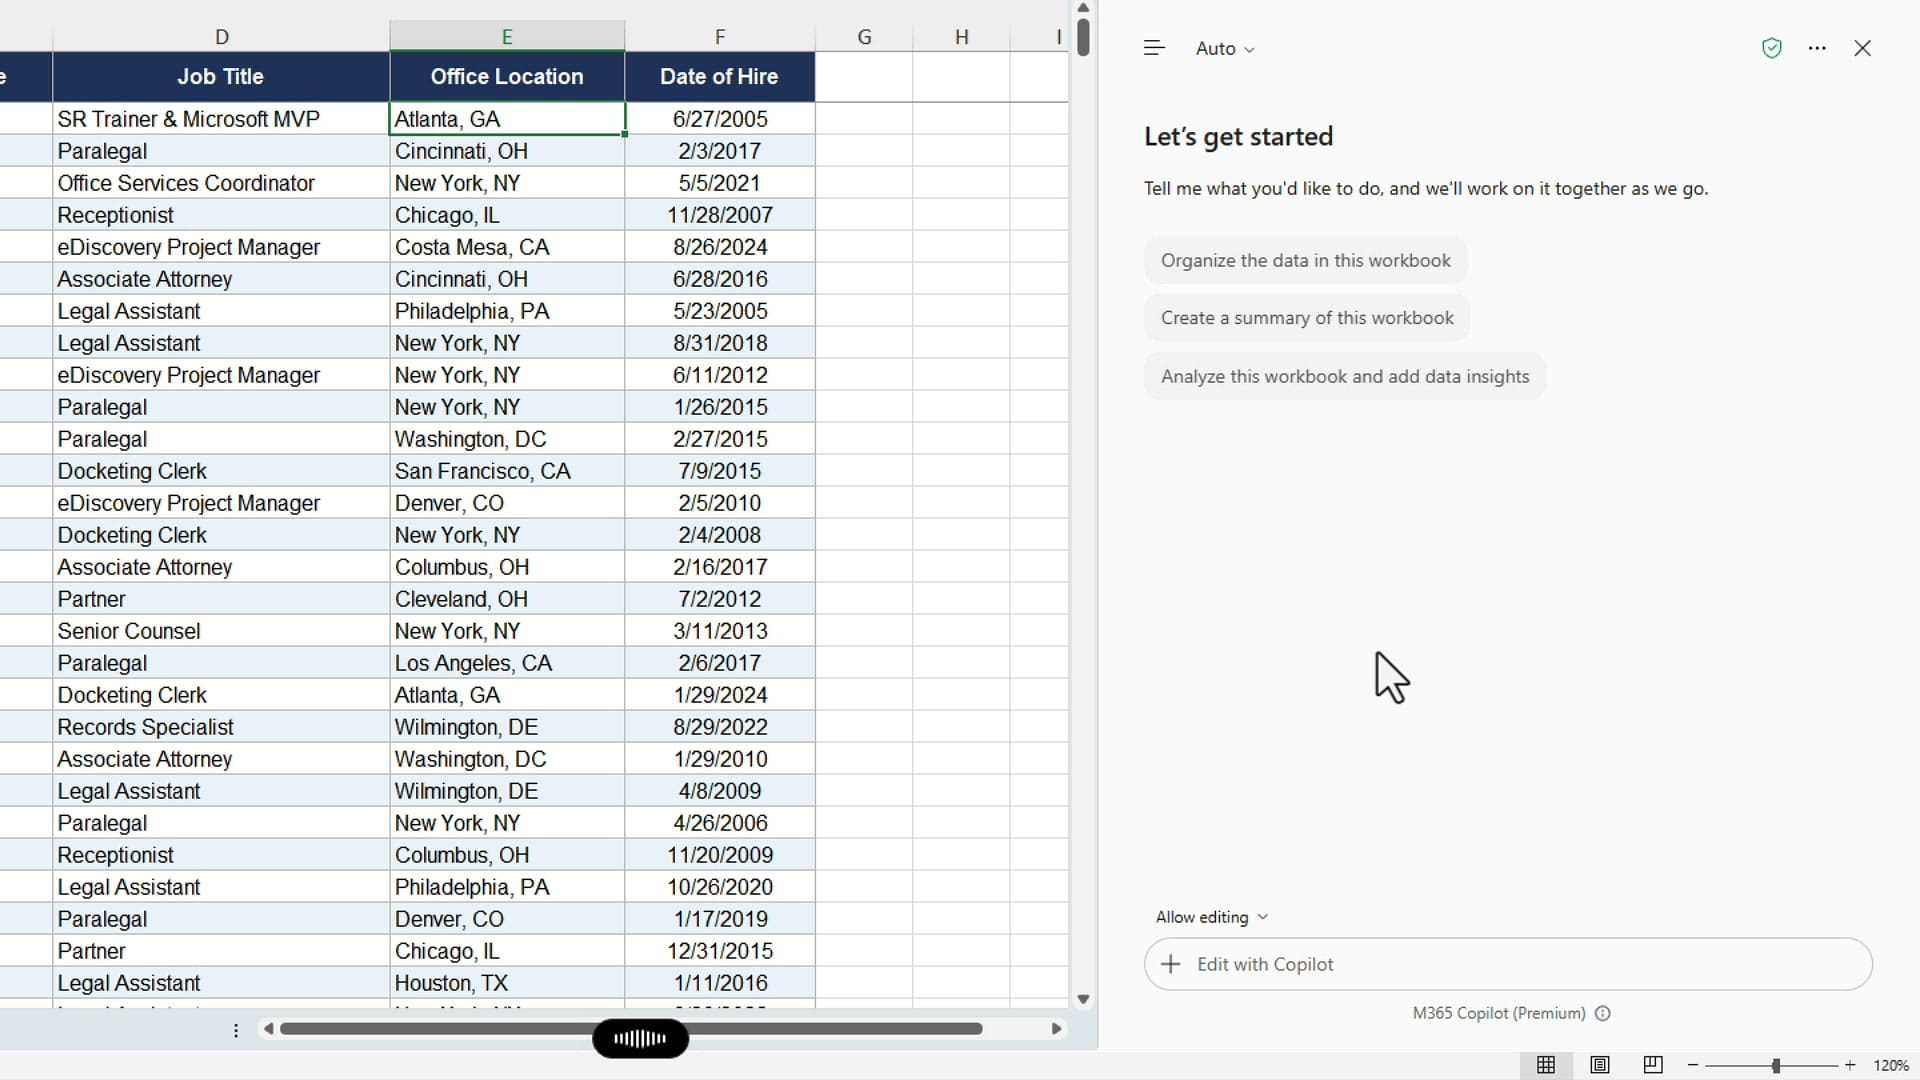
Here is the key idea: I don't want to keep prompting Copilot over and over, so I ask for everything in one go. I click in the editing box and dictate the prompt instead of typing it. Speaking a long, multi-part request is much faster. I cover dictation in more detail in how to use Copilot app skills and voice prompts in Excel.
Here is the exact prompt I used. Copy it and try it on the sample file:
Take the employee worksheet, and I'm going to want two new worksheets created from it. The first worksheet is going to have:
- a list of all unique office locations
- another column for what time zone those office locations are in
- a third column showing me the number of employees in each office location

I also want a worksheet with a chart or a graph for all the different time zones and a percentage of the number of employees in each time zone. Feel free to do whatever you want to, but I'd also like to see some data bars and a chart.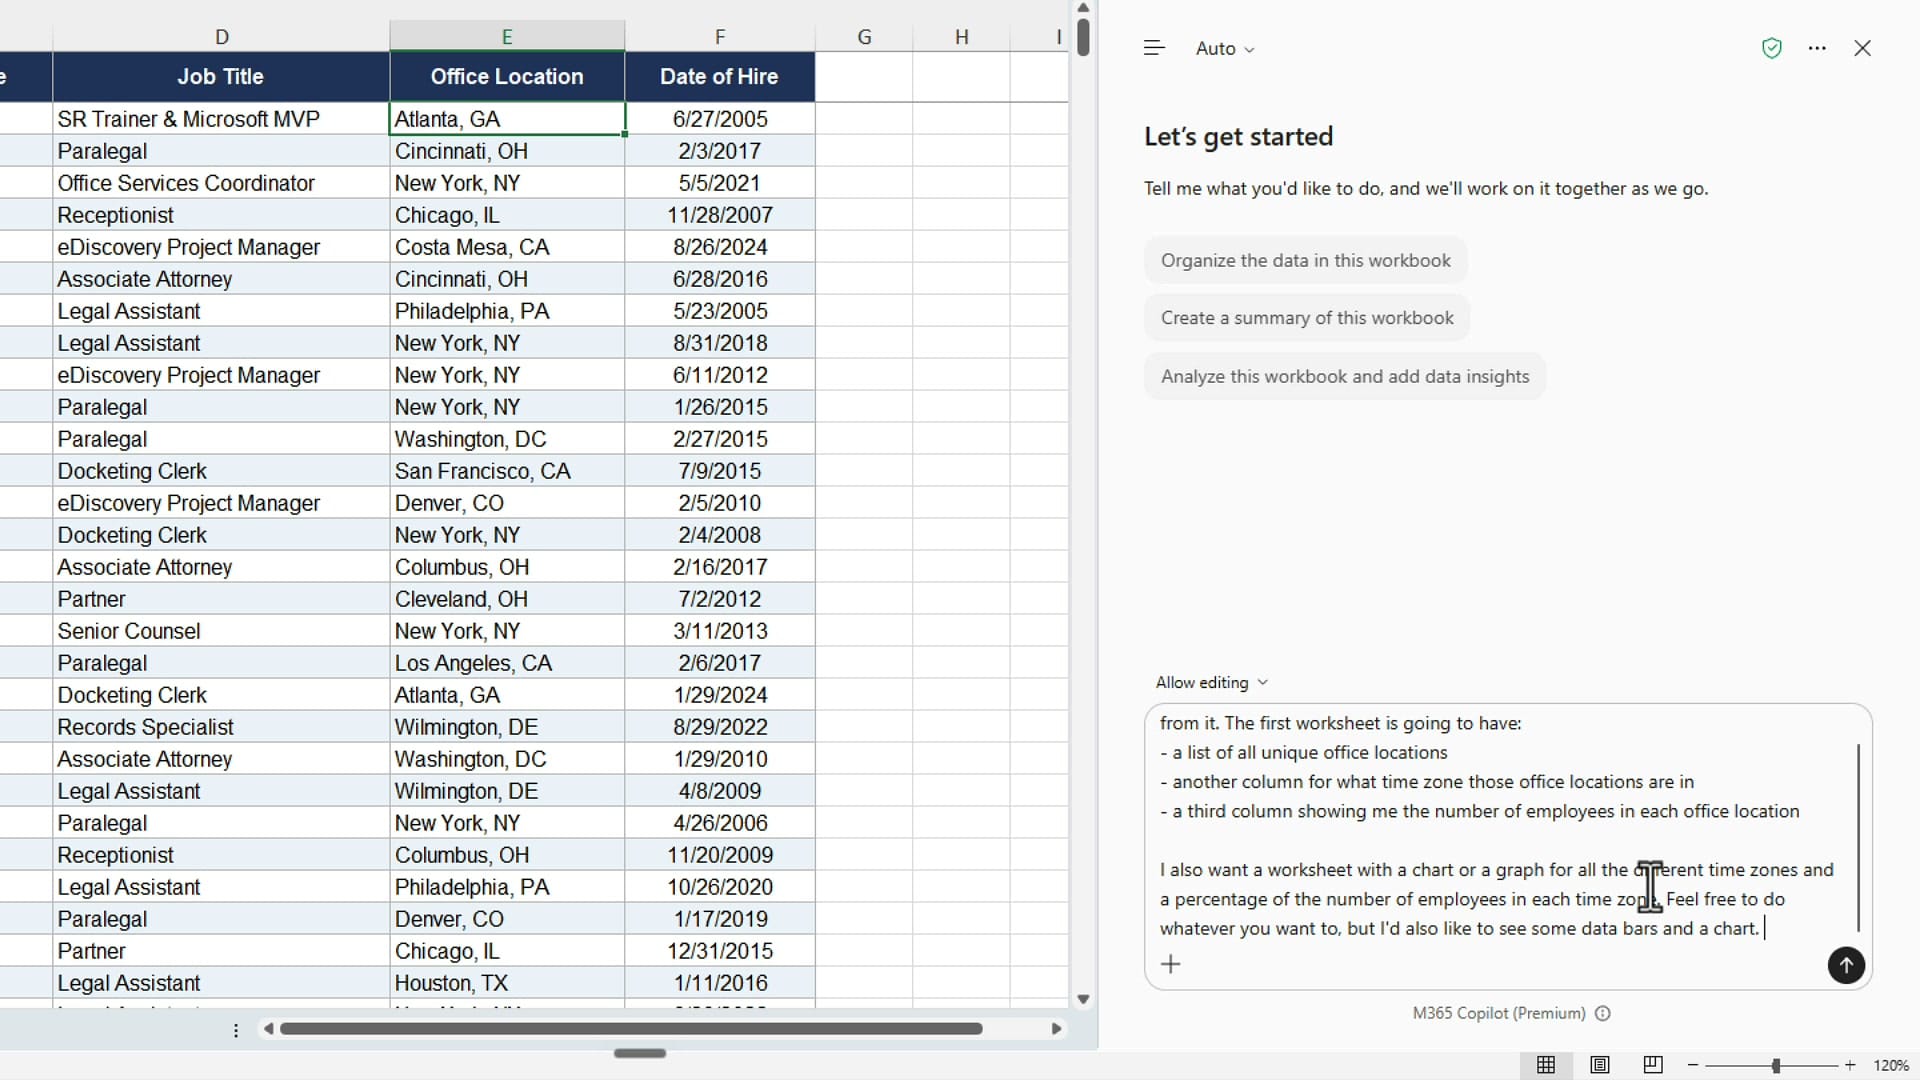
Notice the last sentence: "Feel free to do whatever you want to." I tell Copilot what I need, but I leave room for it to make sensible design choices for the dashboard.
Send it and let Copilot work
Click the send arrow. Copilot starts working through the request and shows you what it's doing as it goes. For this prompt it took about 54 seconds to build both worksheets.
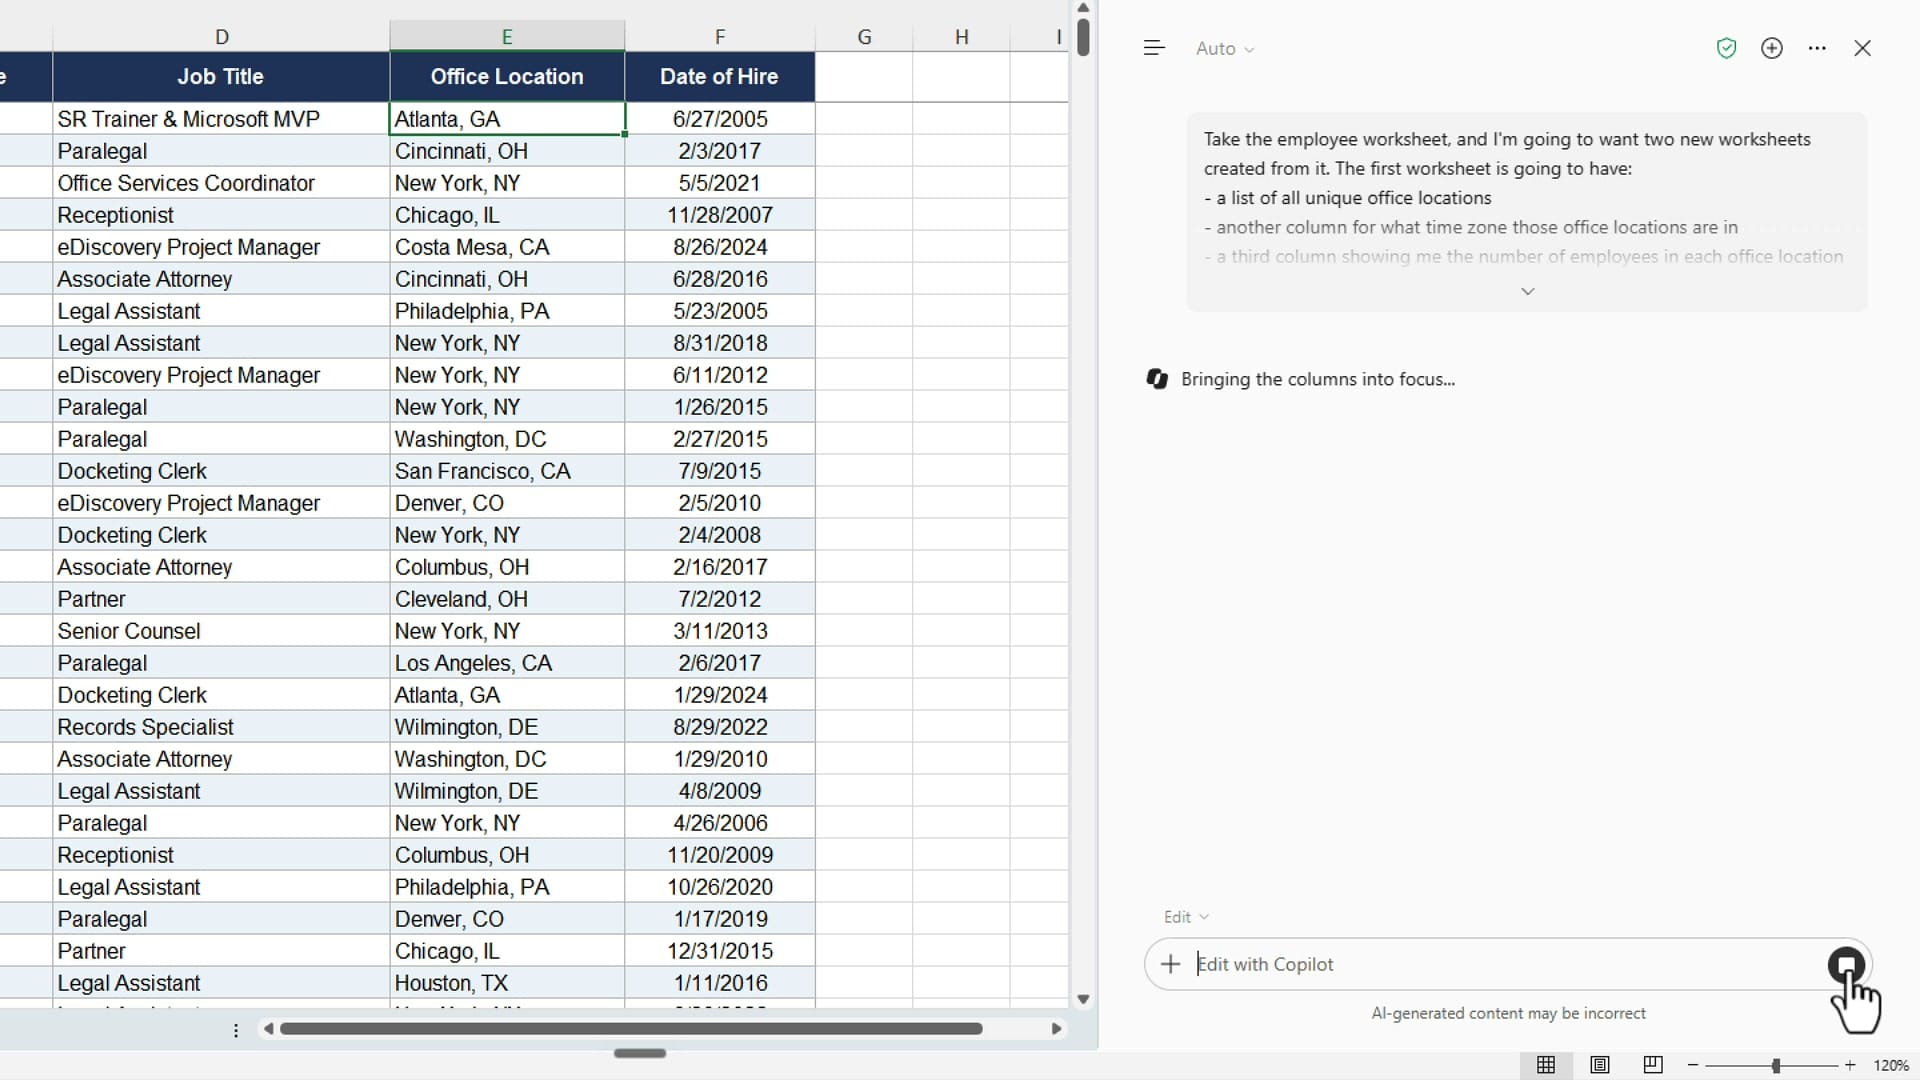
When it finishes, click Done to keep the changes. You'll see two new worksheet tabs at the bottom of the workbook: Office Locations and Time Zone Dashboard.
Check the Office Locations worksheet
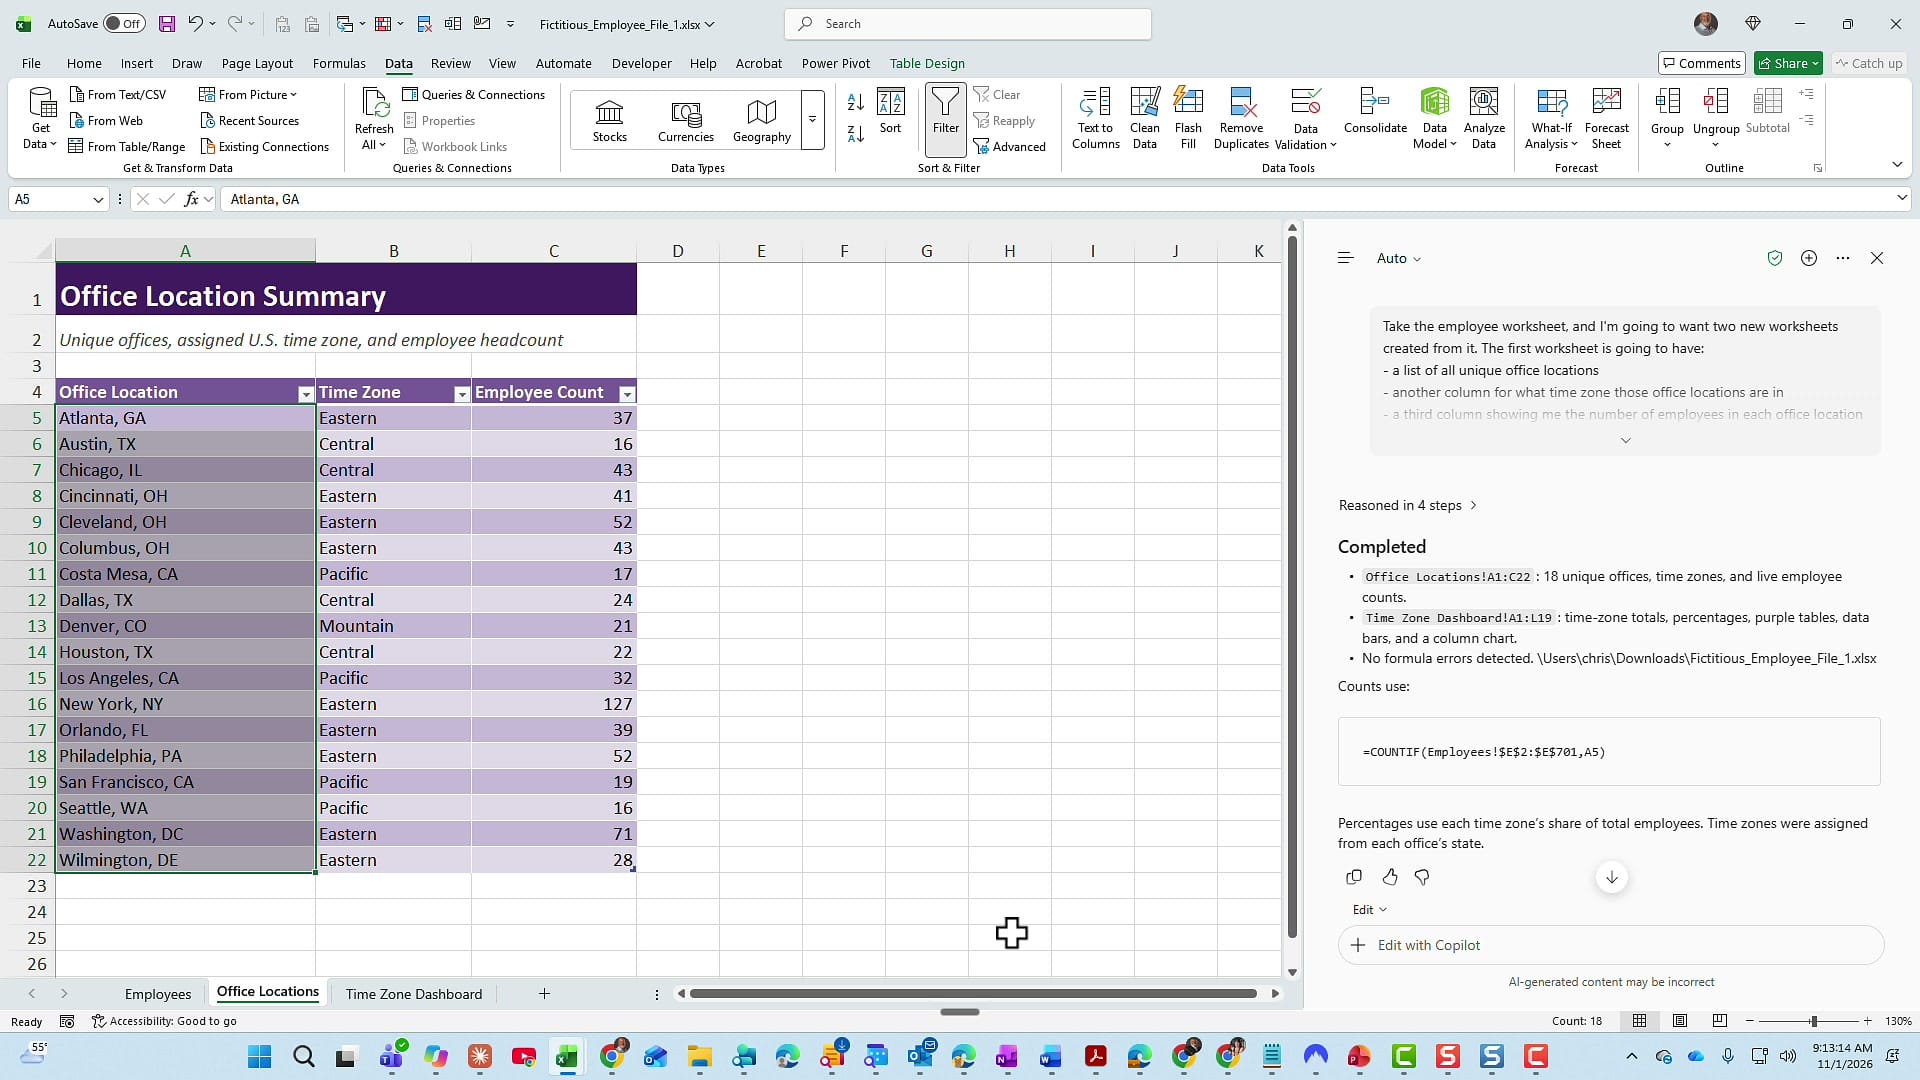
The first new sheet is an Office Location Summary. It lists every unique office, the U.S. time zone each office is in, and the employee headcount. I know there should be 18 unique office locations, and there are exactly 18. New York has the most employees with 127.
The counts aren't typed in. Copilot used a COUNTIF formula against the Employees sheet, so the numbers stay live if the source data changes. You can see the formula in the Copilot pane's summary of what it did.
Check the Time Zone Dashboard
The second sheet is the dashboard. It rolls the offices up into four time zones with an employee count and a percentage for each: Eastern 490 (70%), Central 105 (15%), Pacific 84 (12%), and Mountain 21 (3%). Data bars run through both the count and percentage columns, and a column chart titled "Percentage of Employees by Time Zone" sits right next to the table. The four counts add up to all 700 employees, which tells me nothing was missed.
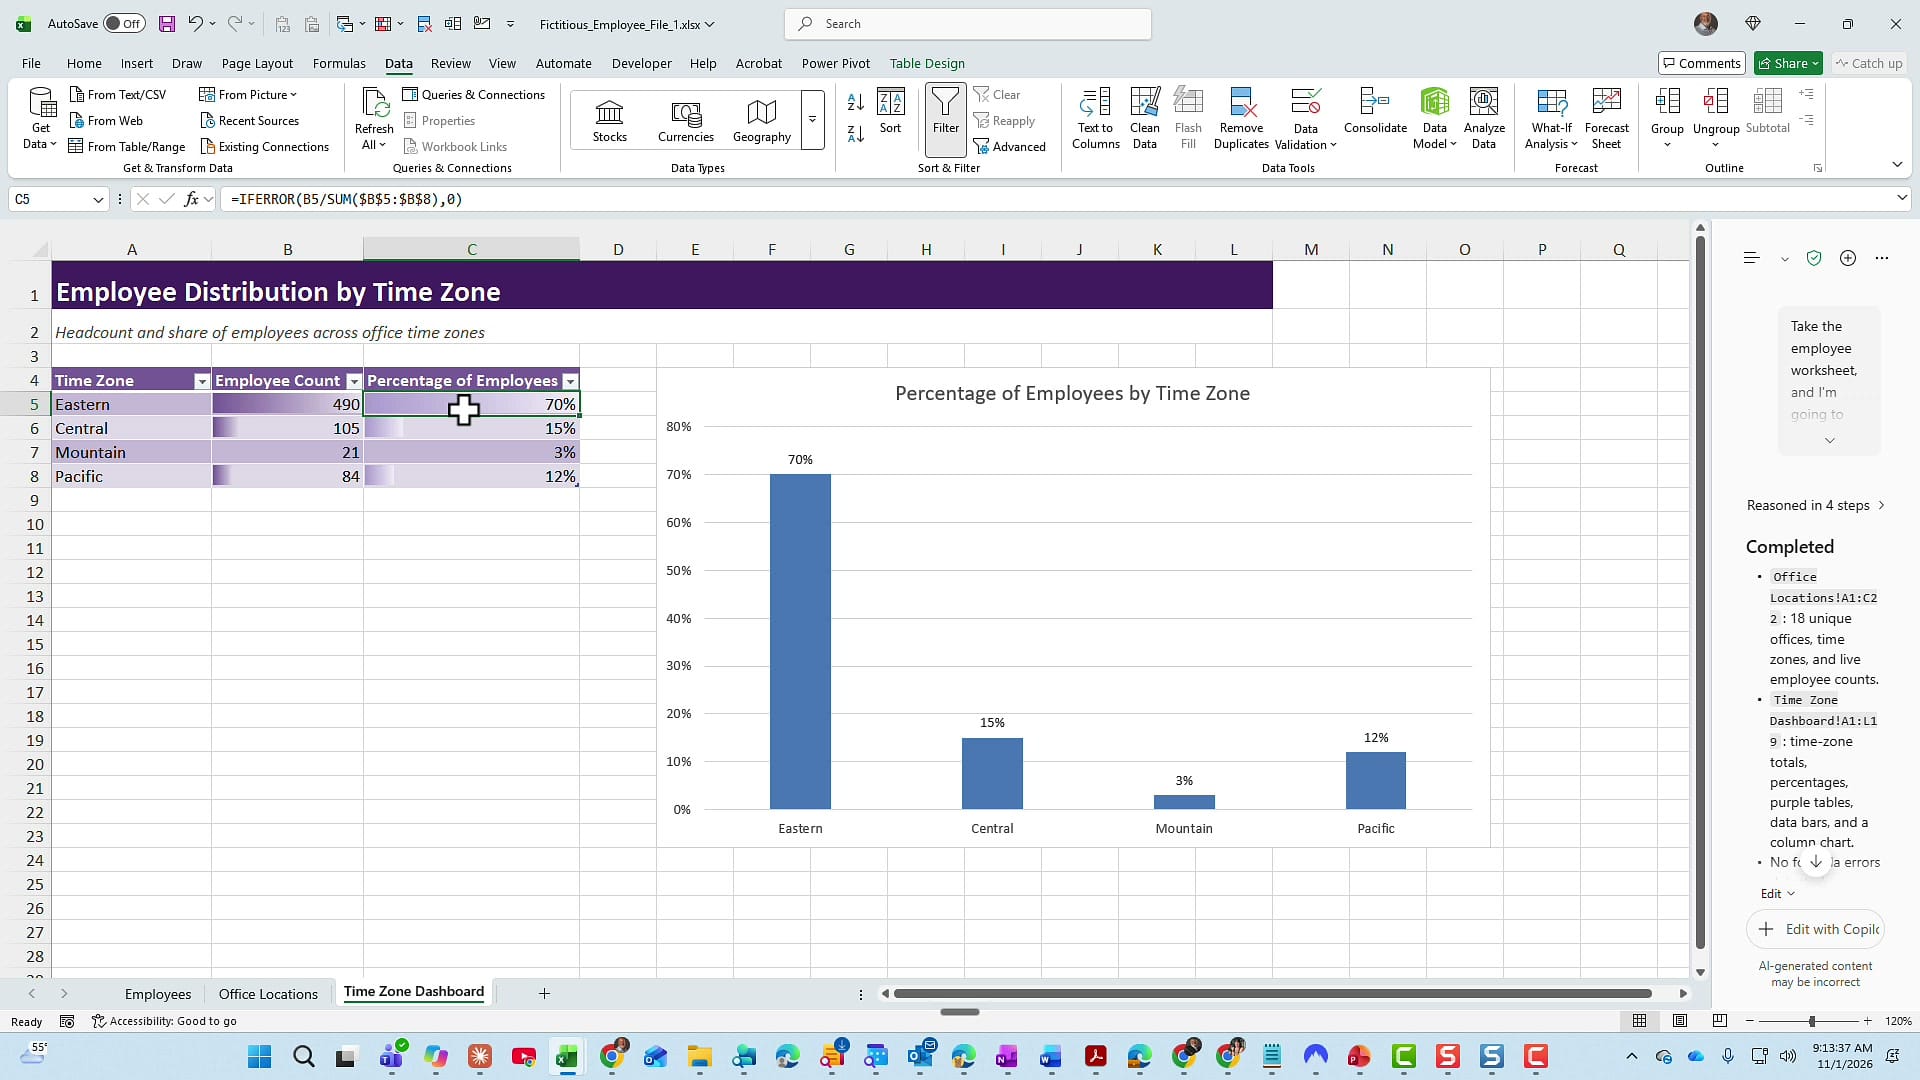
That is exactly what I asked for. If you want to go further with Copilot-built dashboards, take a look at building dashboards with Agent Mode in Excel.
Try it yourself
The sample employee file is attached to this post along with the prompt above. Download the file, copy the prompt, and run it in your own copy of Excel. Once you see Copilot handle several worksheets at once, you'll start writing bigger prompts instead of a string of small ones.
Related guides
 Chris Menard
 Chris Menard
 Chris Menard
 Chris Menard
 Chris Menard