
Copilot Vision in Excel: Talk to Copilot and Share Your Screen
Copilot Chat can see your screen and hear you at the same time. Start a voice chat, share your Excel window, and ask for highest, lowest, totals, averages and rankings out loud — no typing, no formulas.


Copilot Chat can now see your screen and hear you at the same time. You start a voice chat, share a window or your whole desktop, and then you just talk. No prompt box, no typing — Copilot answers out loud based on what it is looking at.
I had already tried this in PowerPoint and on the web. Here I am putting it to work on an Excel file with a table and a chart, asking the kind of questions you would normally write a formula for. It got every answer right, but there is one limit you need to understand before you start trusting it.
Copilot only sees what is on screen
Copilot Vision reads your screen. That is the whole idea, and it is also the catch. If your table or range runs past the bottom of the window, the rows you cannot see are rows Copilot cannot see either. Ask for a total and you get a total of the visible rows, not of the whole data set.
So before you ask anything, get the entire range on screen. Scroll to the top, and zoom out with Ctrl + mouse wheel or the zoom slider in the bottom-right corner of Excel until the last row is visible. If the data will not fit on one screen, this is the wrong tool for that question — let Copilot Chat suggest a function instead and put the calculation in the sheet.
The feature is new, and it does not get everything right. Check the answers on anything that matters.
Start a voice chat in Copilot Chat
Open Copilot Chat on the desktop. At the right end of the Message Copilot box you will see two icons: a microphone, which is dictation, and a waveform icon beside it. The waveform is the one you want — hover over it and the tooltip reads Start a new voice chat.
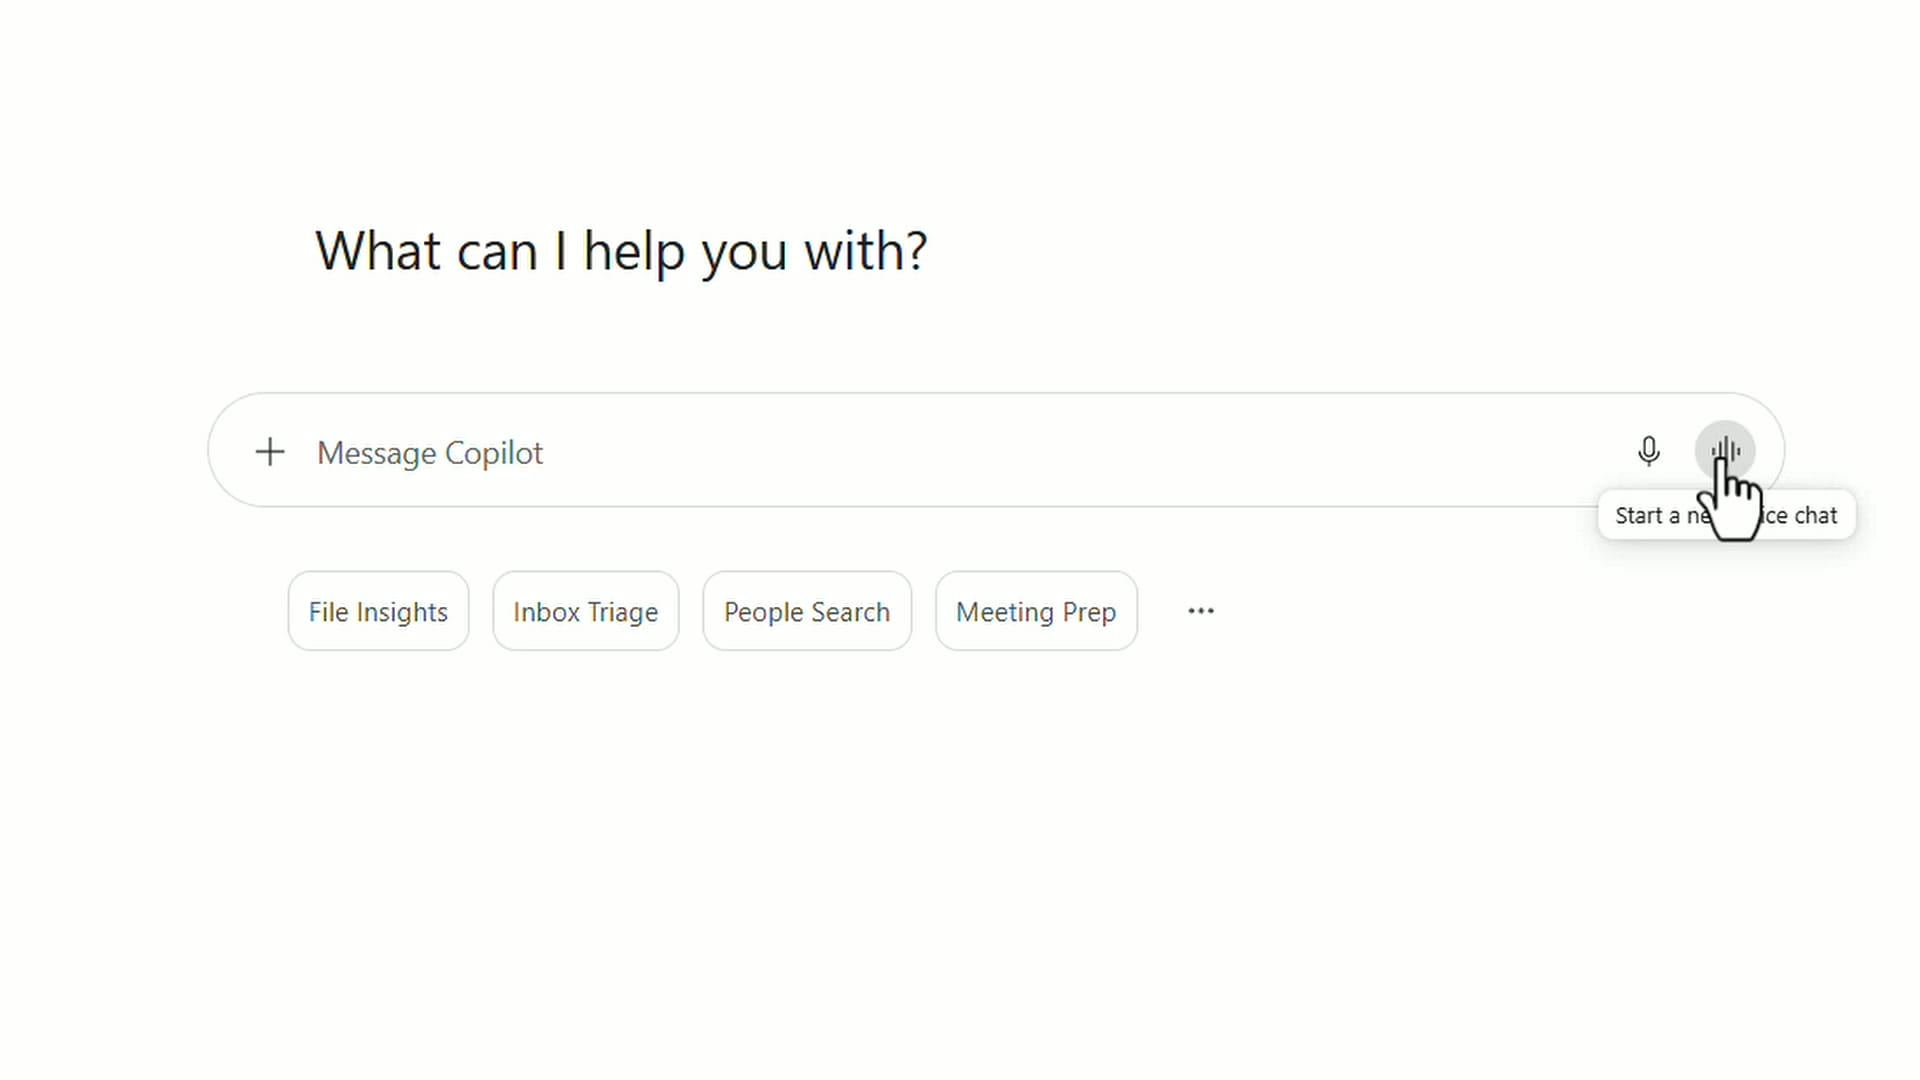
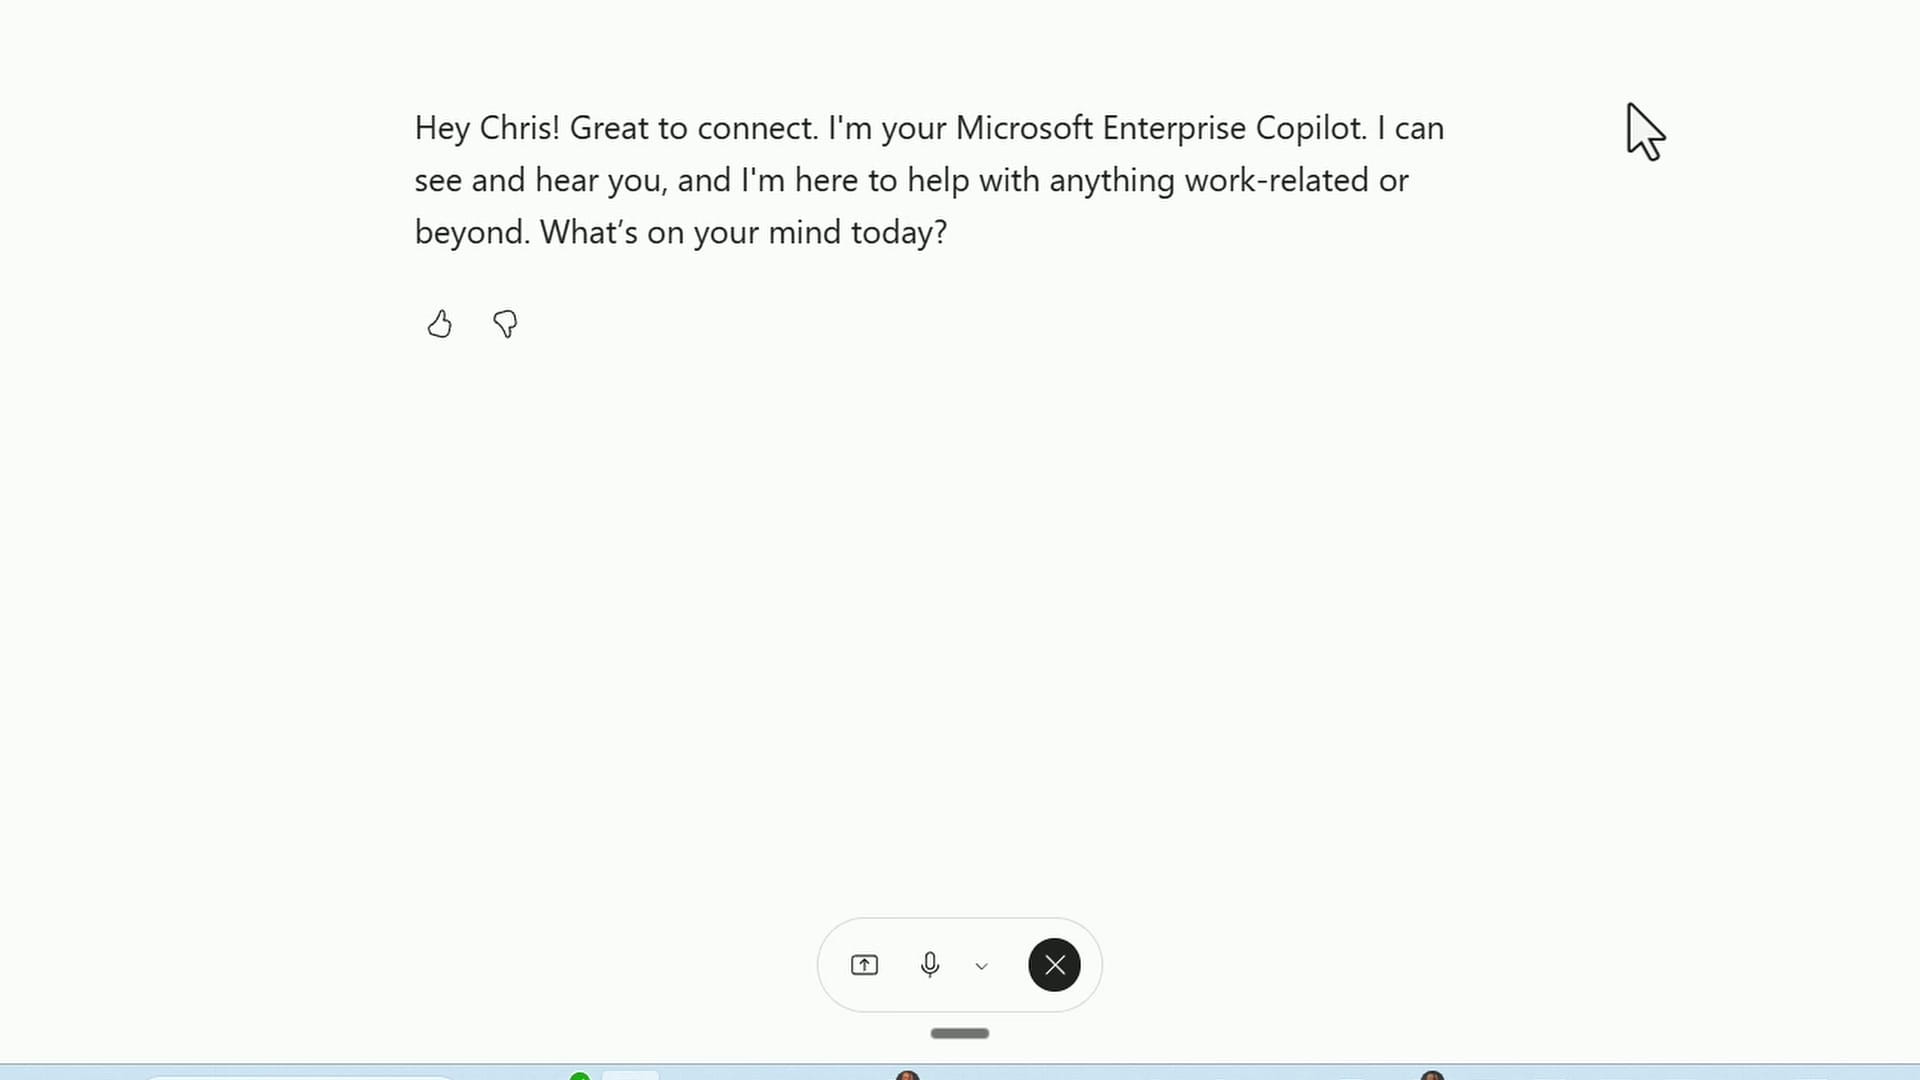
Click it once. Copilot greets you out loud and tells you it can see and hear you. From there the whole conversation is spoken — and everything both of you say is transcribed into the chat window, so you have a written record when you are done.
Share your screen
That toolbar has everything you need. The first button — a box with an arrow — is Start Screen Share. Next to it is the mute microphone, and the black X ends the call.

Windows then asks what you want to share, with two tabs: Window and Entire Screen. Choose Window and pick your workbook if you only want Copilot looking at the spreadsheet. Choose Entire Screen if you plan to move between apps during the conversation.
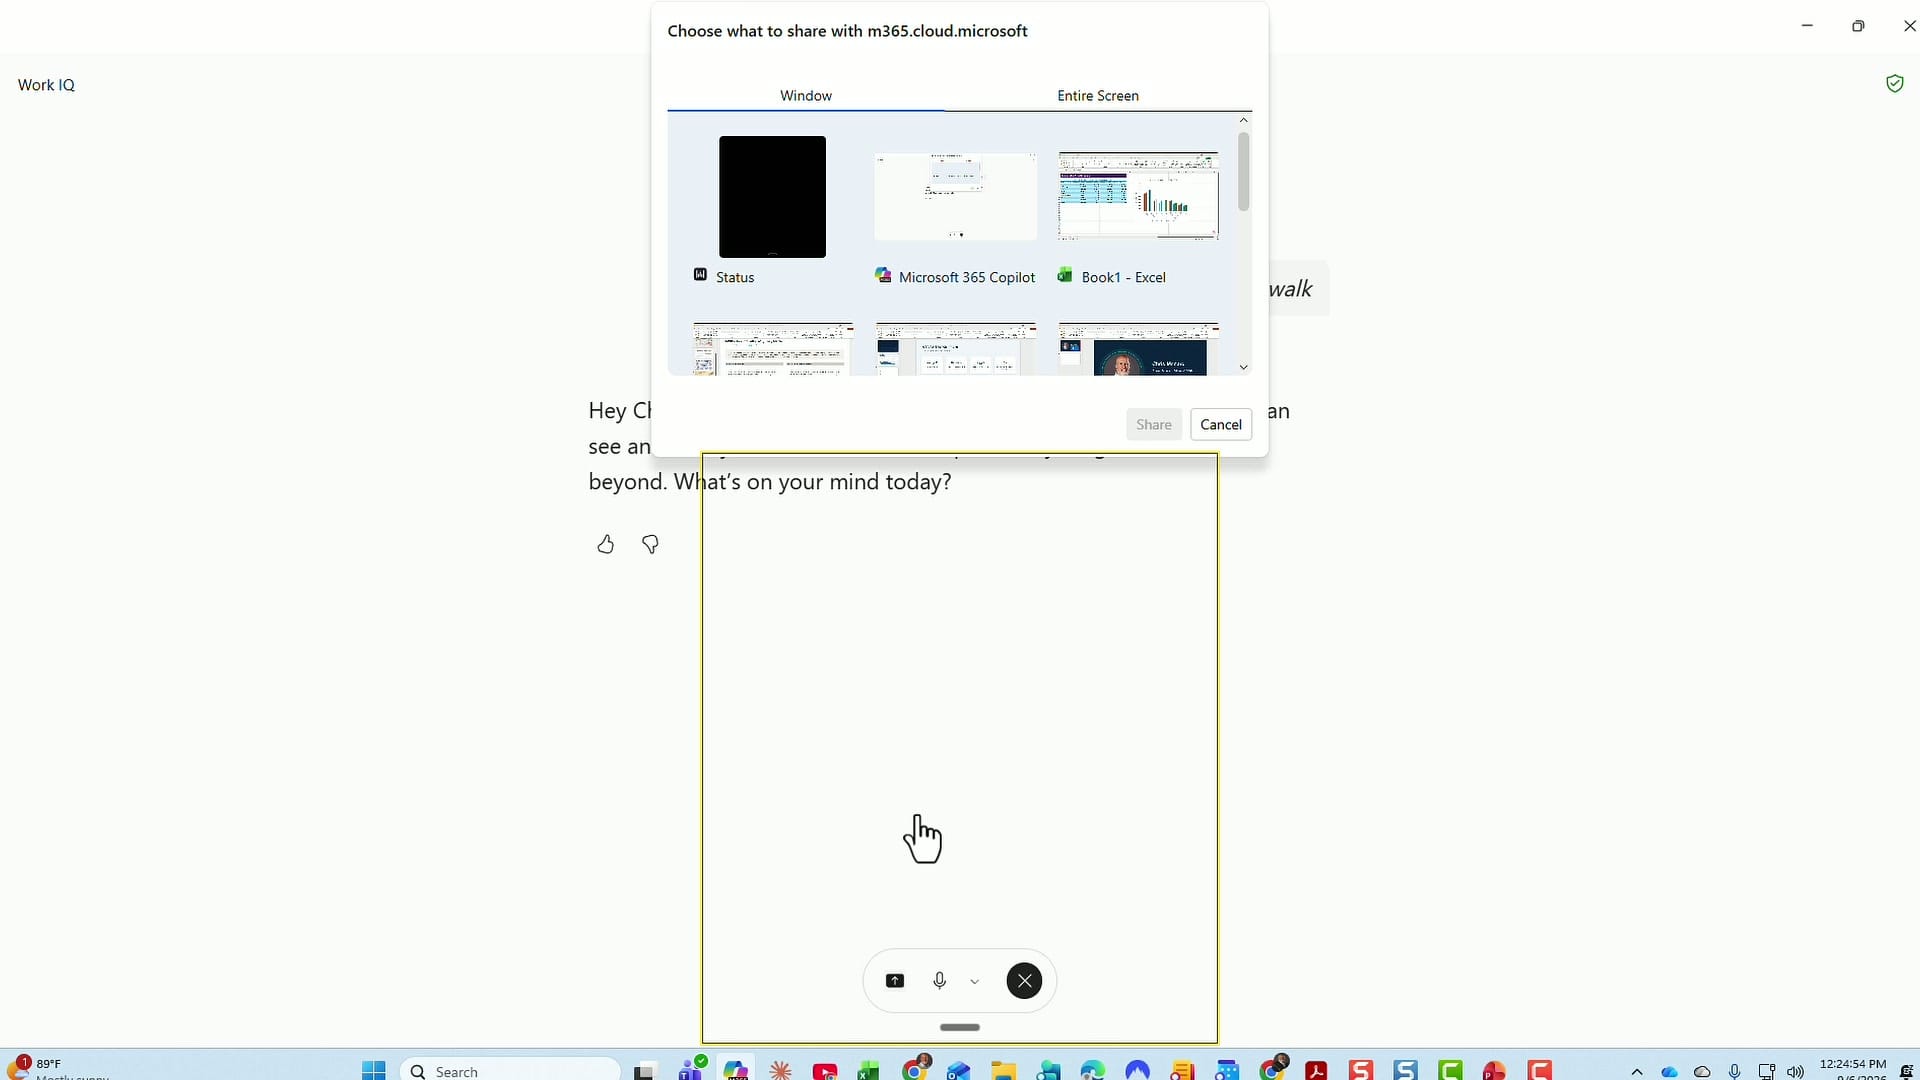
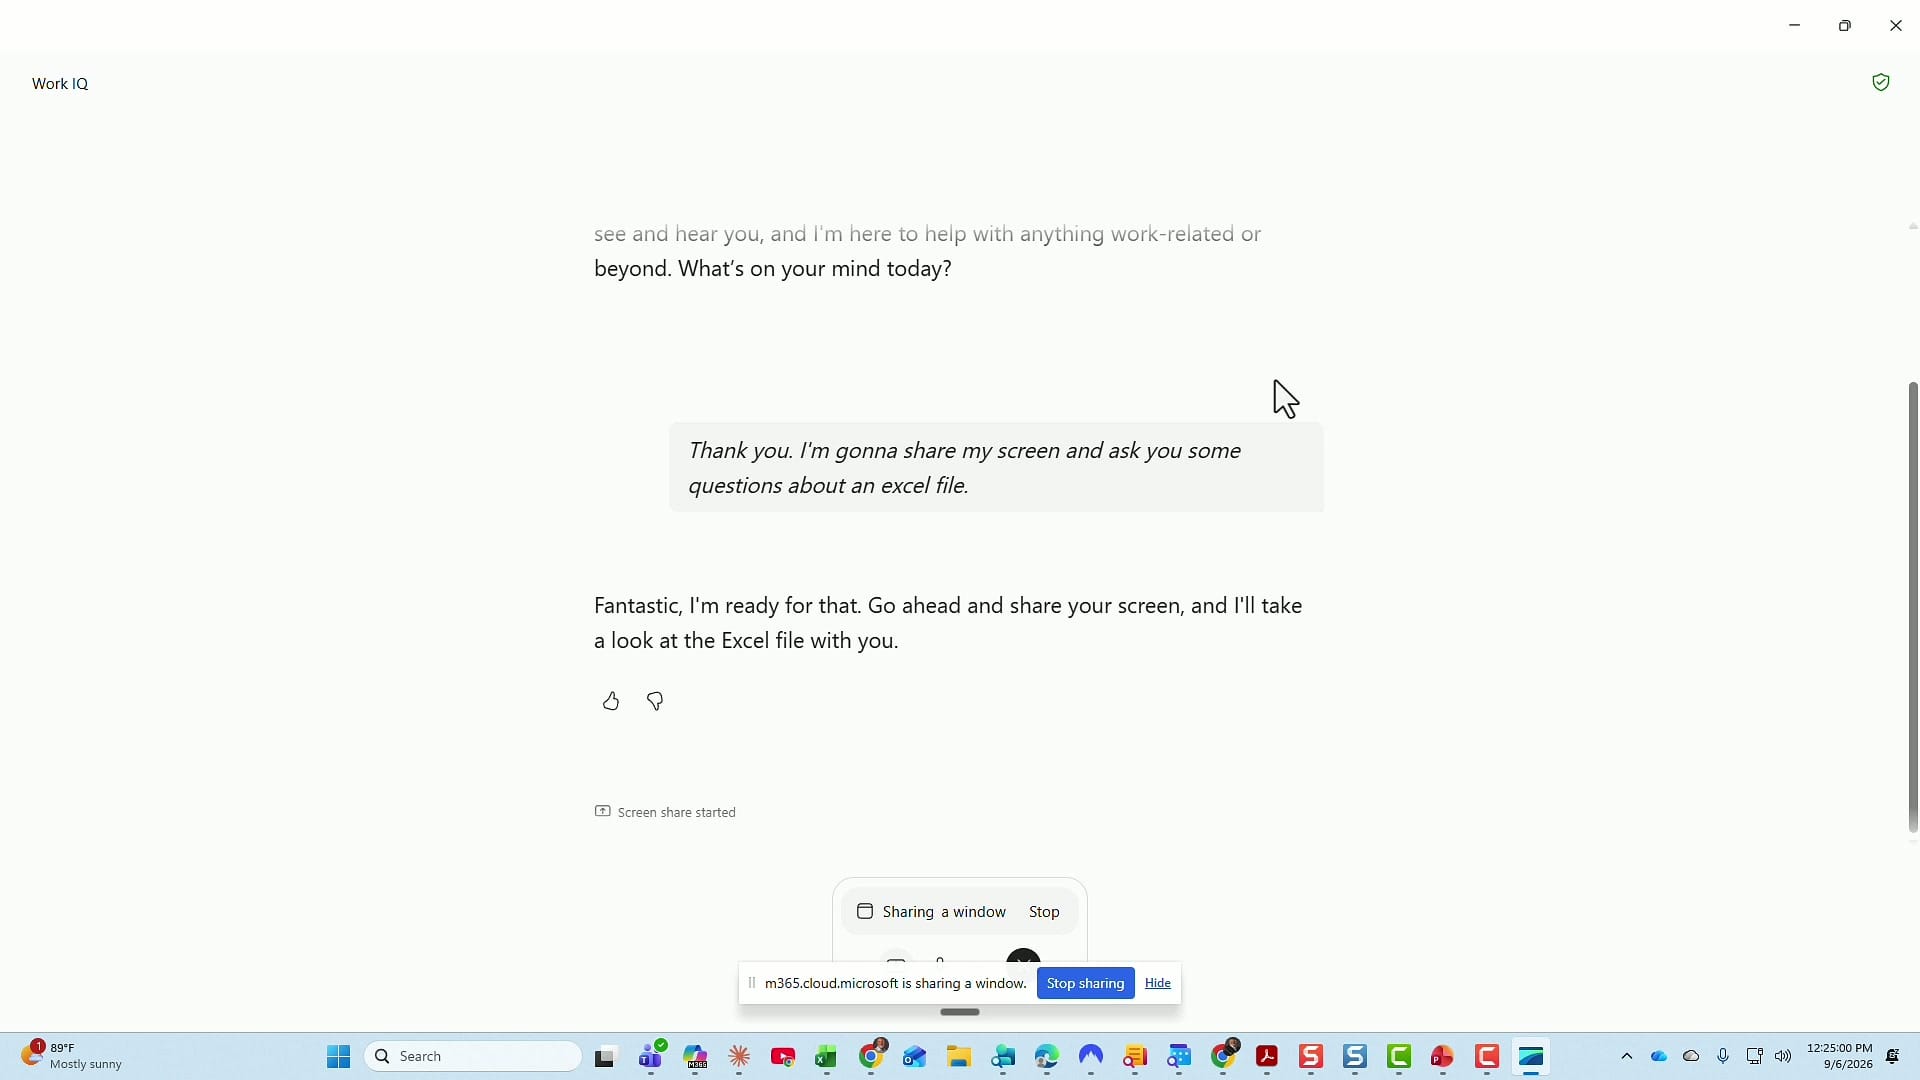
Click Share, and Copilot confirms in the chat with Screen share started. The standard Windows sharing bar also appears at the bottom of the screen with a Stop sharing button, so you always know when it is watching.
Tell Copilot what it is looking at
This next tip made the biggest difference in my results. Do not share the screen and immediately start firing off questions. Spend ten seconds describing the layout first.
Here is what I said:
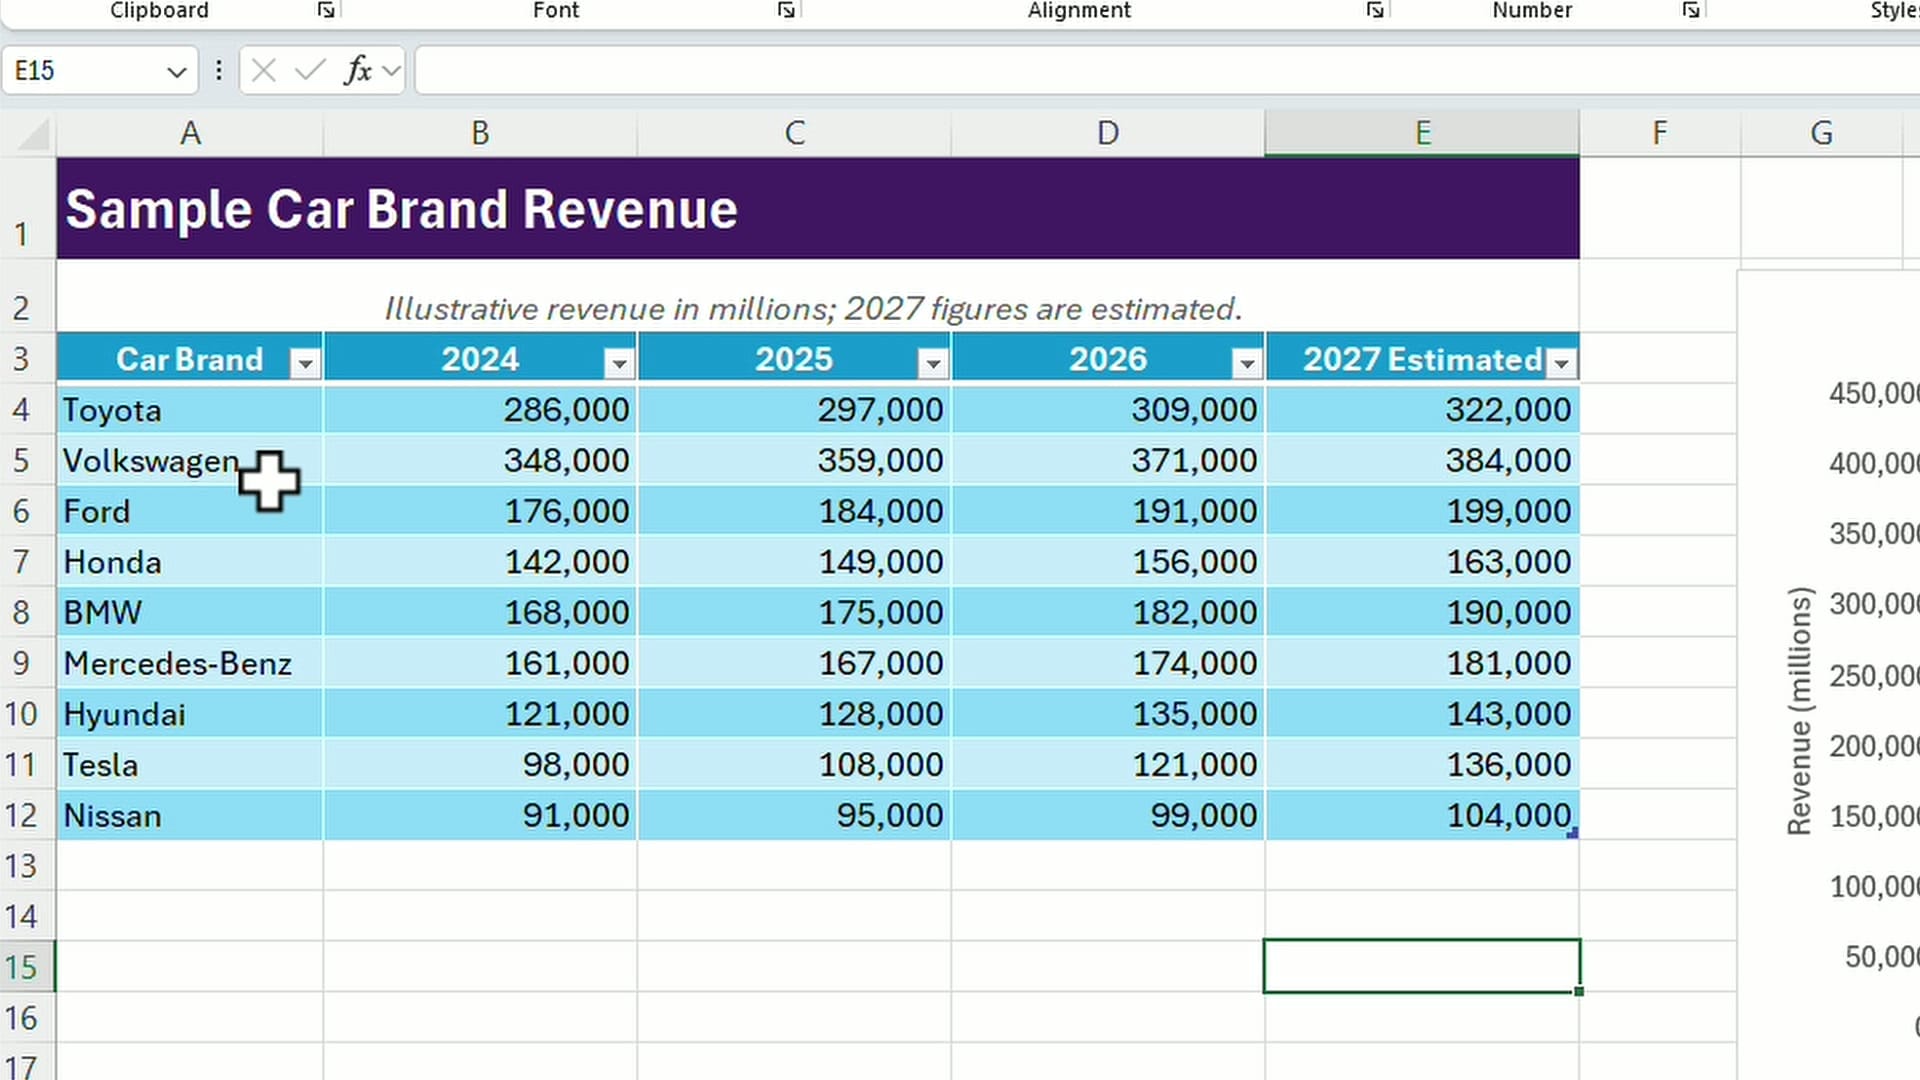
“I have the Excel file pulled up, and I happen to be on just one worksheet right now. Just to help you out, I am going to tell you that it is a table. Car brand is in cell A3, and running across row three are the header rows, so the data is in A4 through E12.”
Copilot came straight back with “I can see the table clearly” and correctly described column A as the car brands. One sentence of context, and everything that follows gets more accurate. It helps that the data is formatted as a Table rather than a plain range — the banded rows and header row give Copilot obvious visual boundaries to work with.
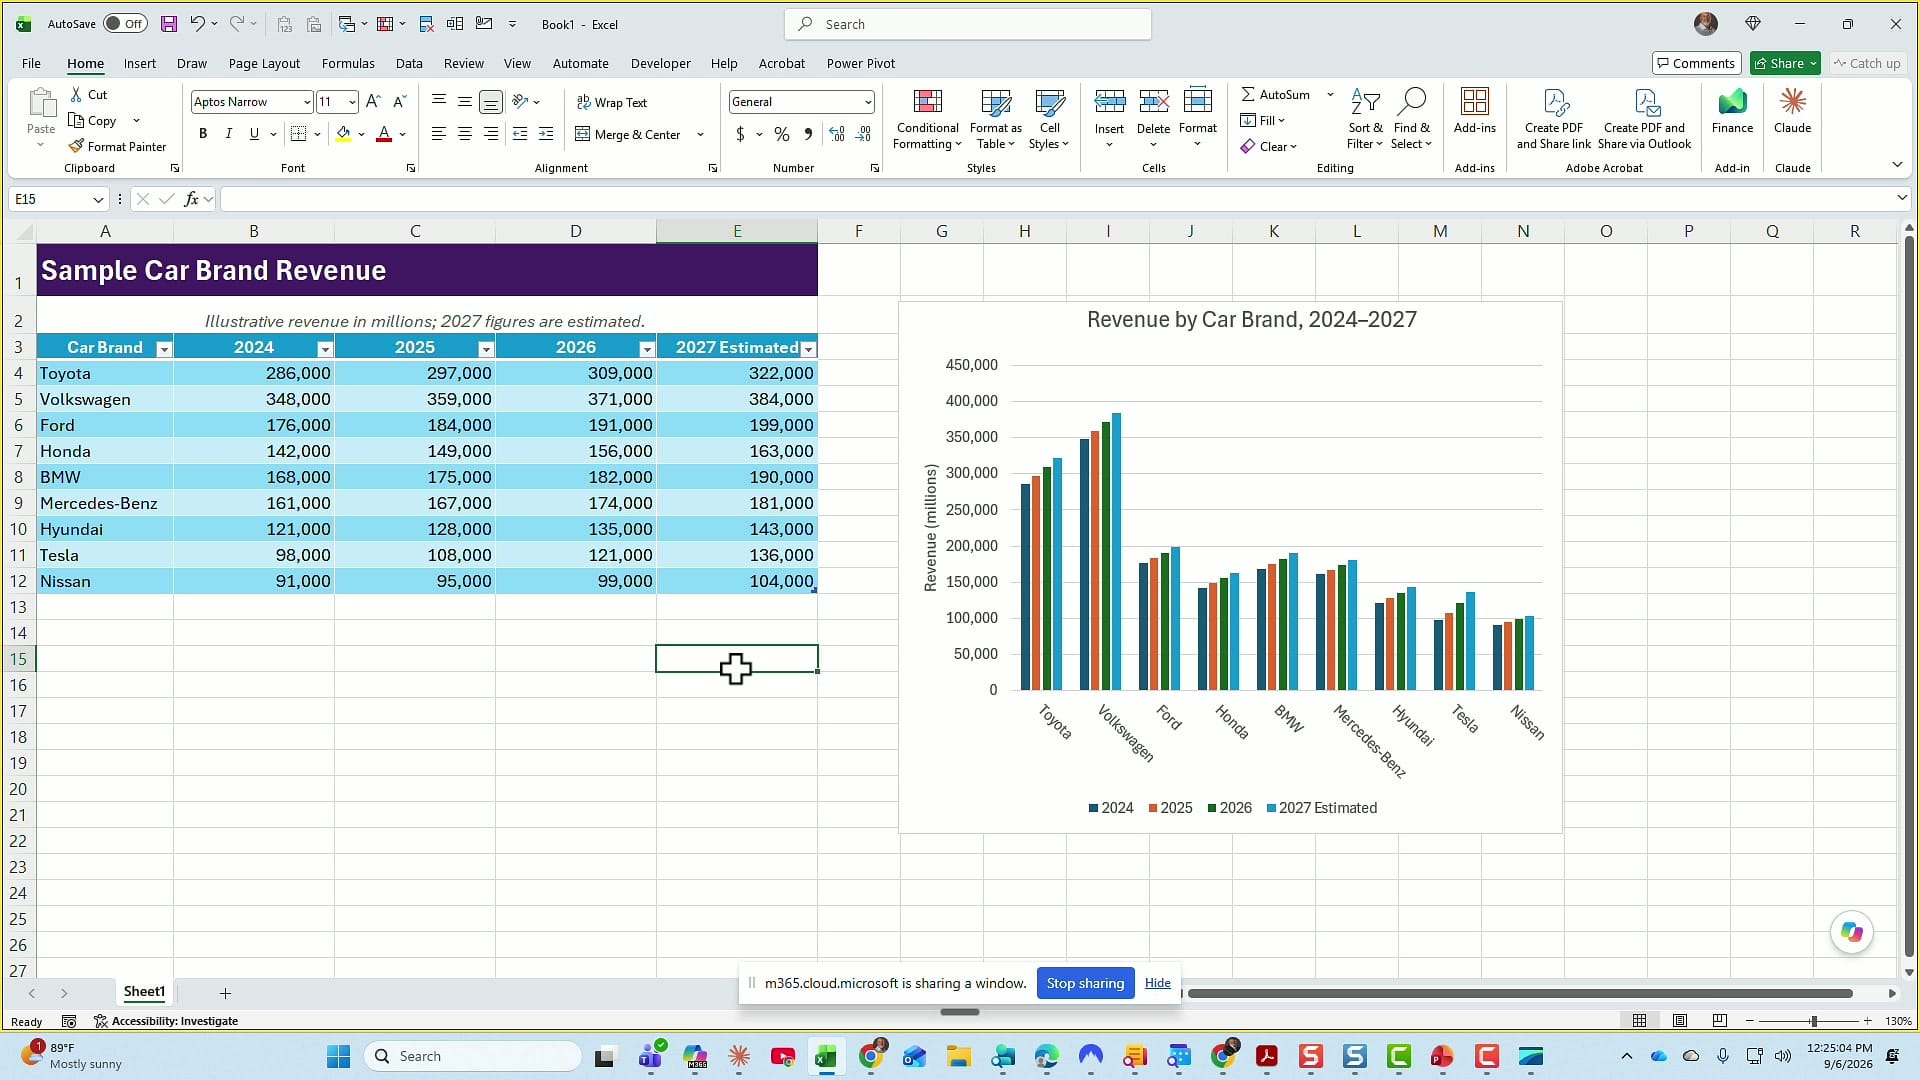
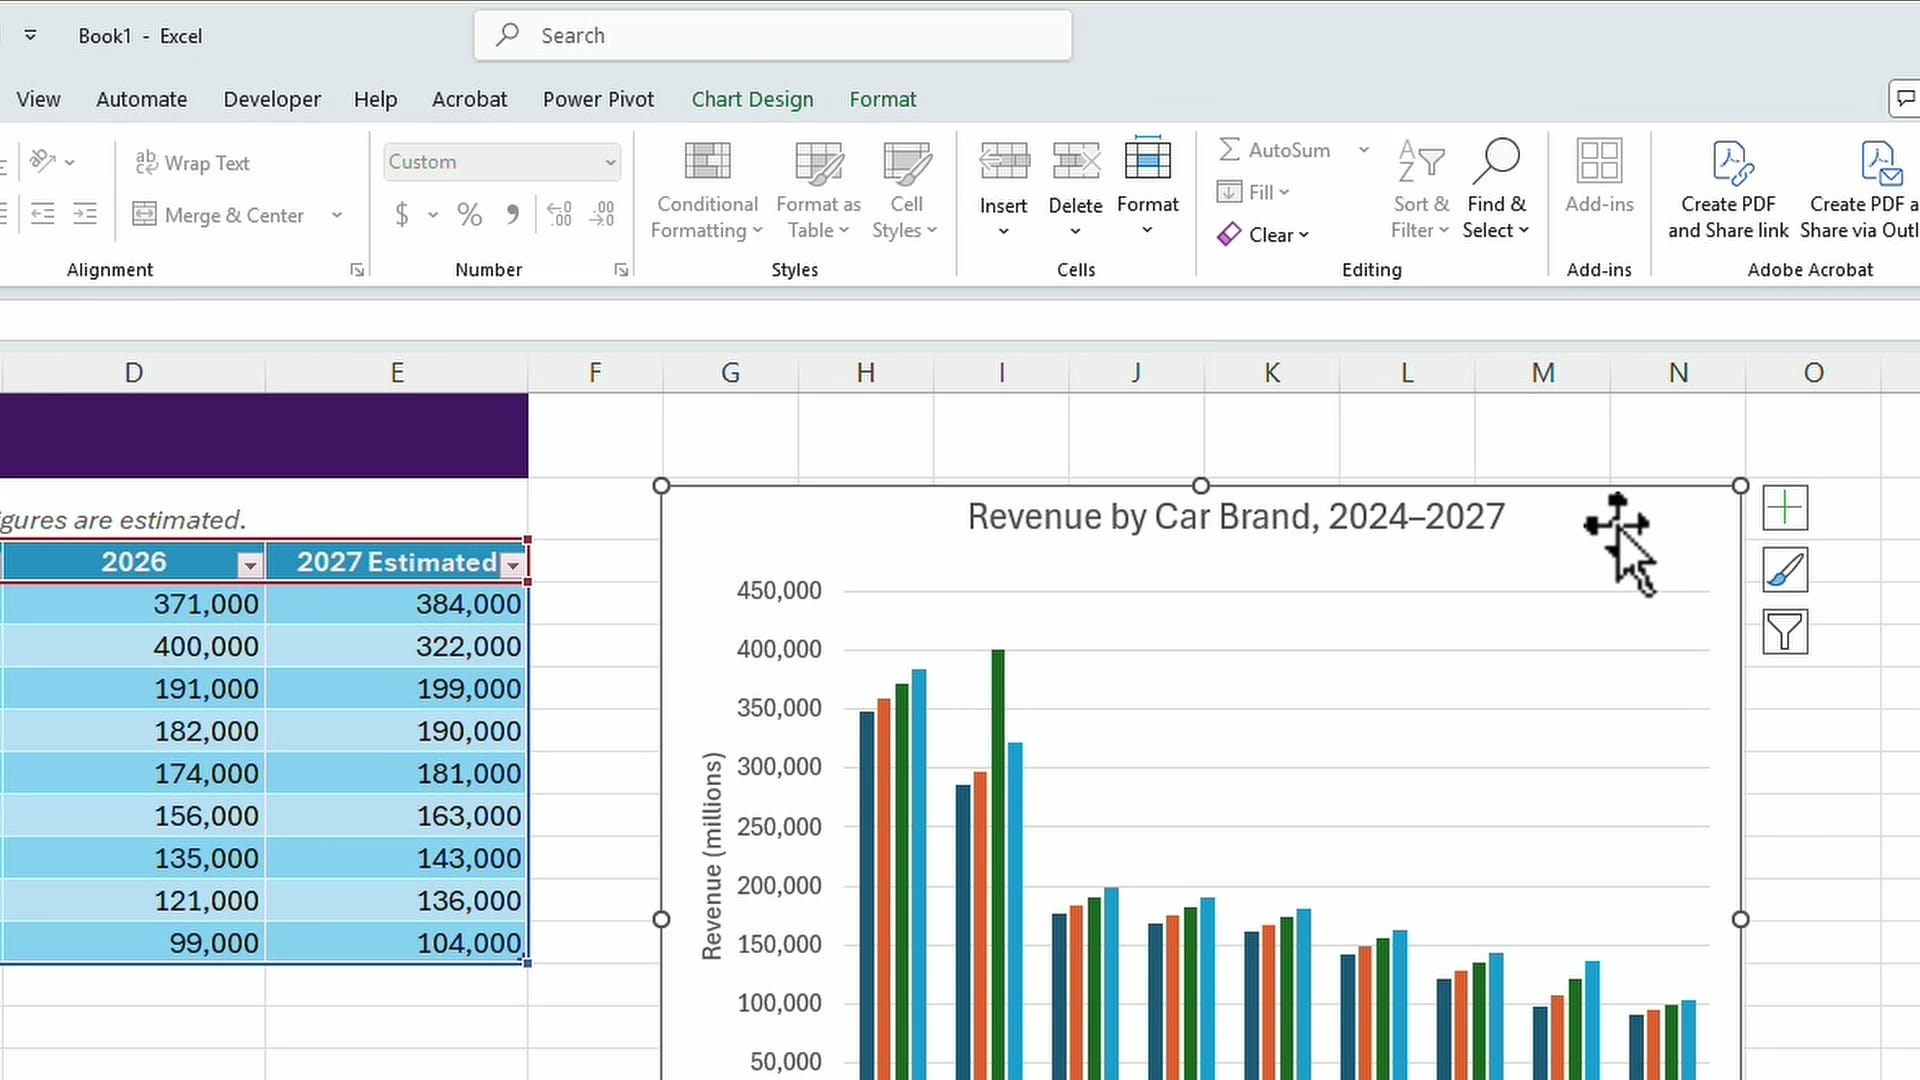
The sample workbook is straightforward — nine car brands, four years of revenue, and a column chart built from the same data.
Ask for the highest and lowest values
First question: “For the year 2026, can you tell me both what car brand had the highest revenue and the lowest revenue?”
The answer came back immediately: highest is Volkswagen at 371,000, lowest is Nissan at 99,000. Both correct. I asked the same thing for 2025 and got Volkswagen at 359,000 and Nissan at 95,000. Correct again.
Notice how the question is phrased. I named the year, asked for both ends of the range in one go, and asked for the brand name as well as the number. You never say MAX or MIN or INDEX and MATCH — you describe the answer you want, the same way you would ask a colleague.
Change the data and ask again
Copilot is looking at a live screen, not a snapshot it took when sharing started. To prove it, I typed a new figure into Toyota's 2026 cell — 400,000, up from 309,000 — and said “I just made a change to the Excel file. Can you now tell me again the highest revenue for 2026?”
“I see the update. For 2026, the highest revenue is now Toyota at 400,000.”
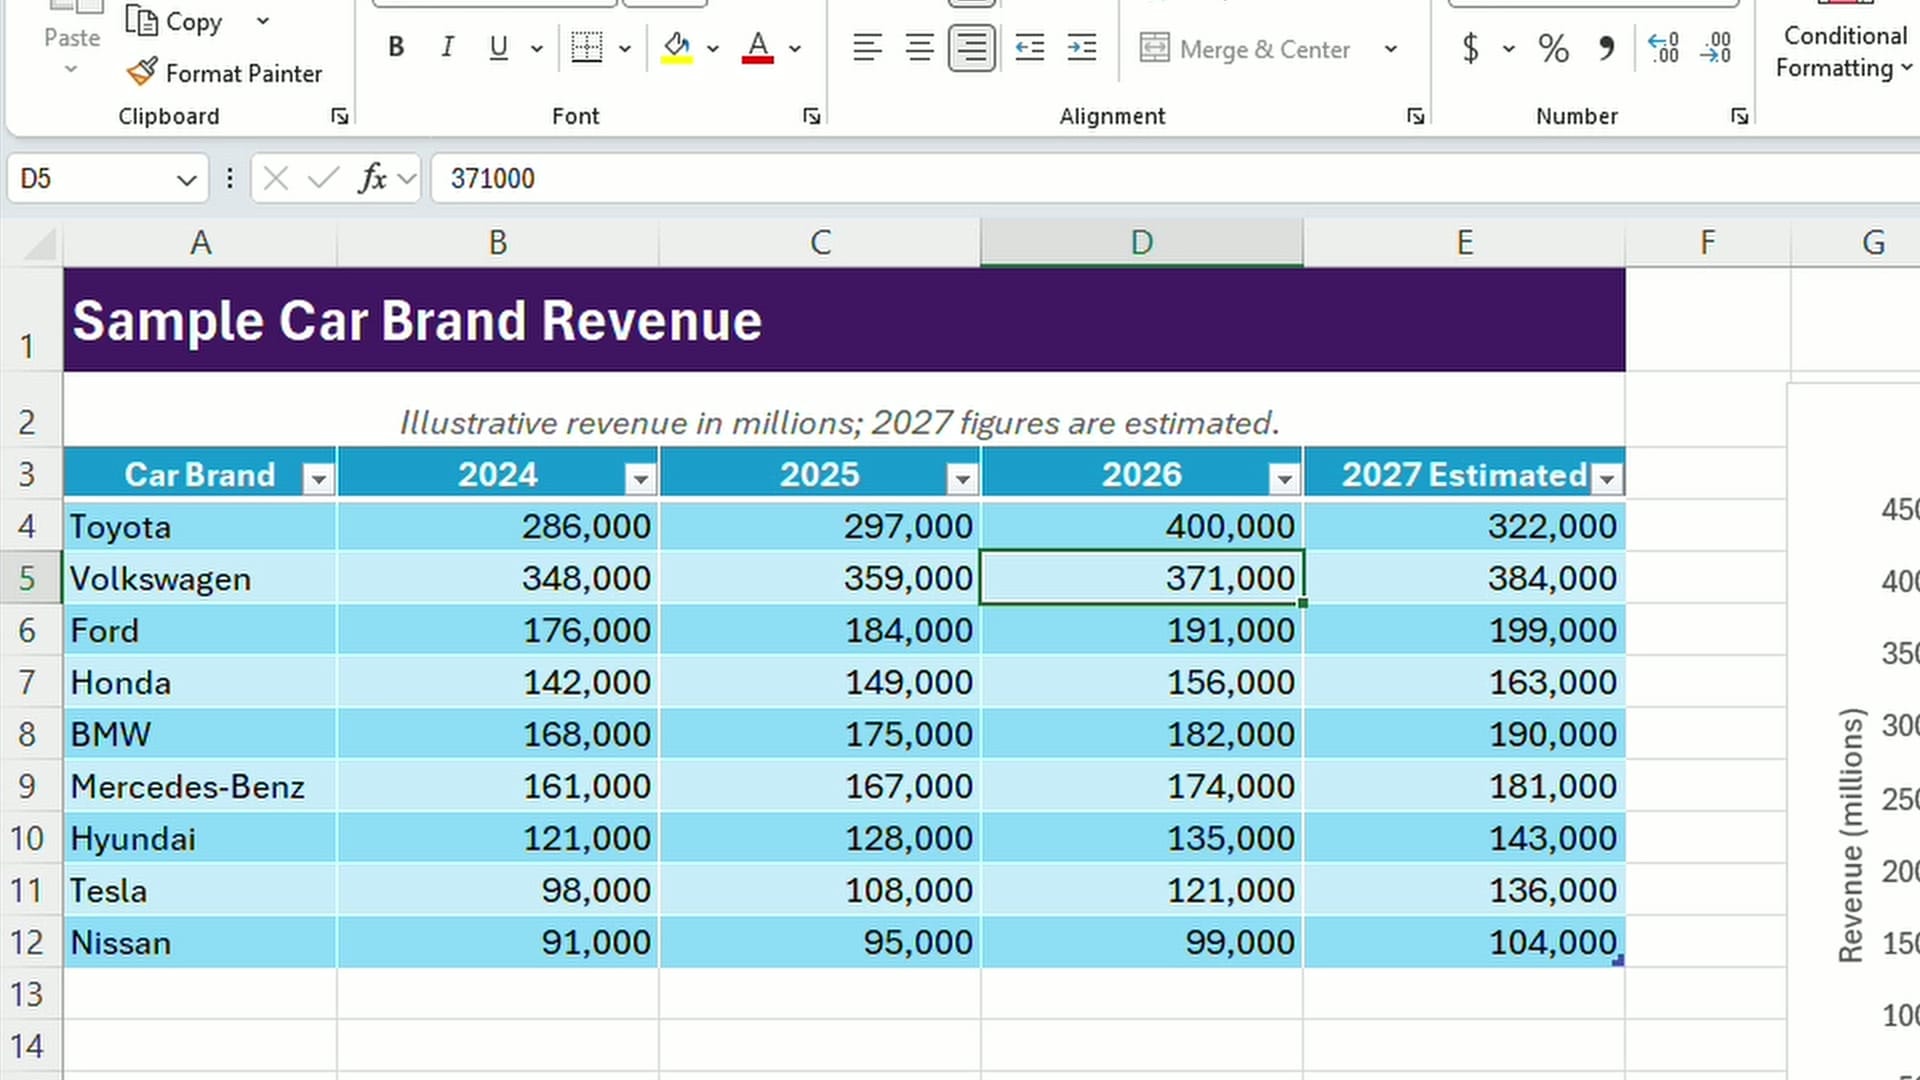
That is the part I like most. Edit, ask, edit, ask. It is a conversation about a document that keeps changing while you talk about it.
Push it: totals and averages
This is where I expected it to fall down, so I said so out loud: “Here is a tricky one for you, and if you cannot do it, tell me you cannot get this right, please. I would like to know what is the total for 2026 and the average for 2026.”
It started narrating the arithmetic — “400,000 plus 371,000 plus 191,000…” — so I cut it off mid-sentence: “Just give me the total and the average. I do not need to hear the formula.”
Straight answer: the total for 2026 is 1,829,000, and the average is about 203,222. Both exactly right.
Two habits worth copying from that exchange:
- Give it an out. Saying “if you cannot do this, tell me” makes it far less likely you get a confident wrong answer.
- Interrupt it. You can talk over Copilot mid-sentence and redirect. Telling it to skip the working and just give me the numbers worked instantly.
Ranking questions: second and third highest
Next: “For the year 2025, I would like to know what is the second highest number and the third highest number, and also the car brand.”
Toyota at 297,000 for second, Ford at 184,000 for third. Correct on both the values and the brands.
Ranking questions like this are exactly where a PivotTable runs out of road and functions such as LARGE take over. Being able to simply ask out loud is a nice shortcut when you need the answer once and do not need a formula sitting in the workbook.
What it will not do: change your chart
The last thing I tried was the chart sitting next to the table. “Any chance you can change the chart that I have sitting on this screen?”
The answer was an honest no: “I cannot directly make changes to the chart myself, but I can guide you step by step.”
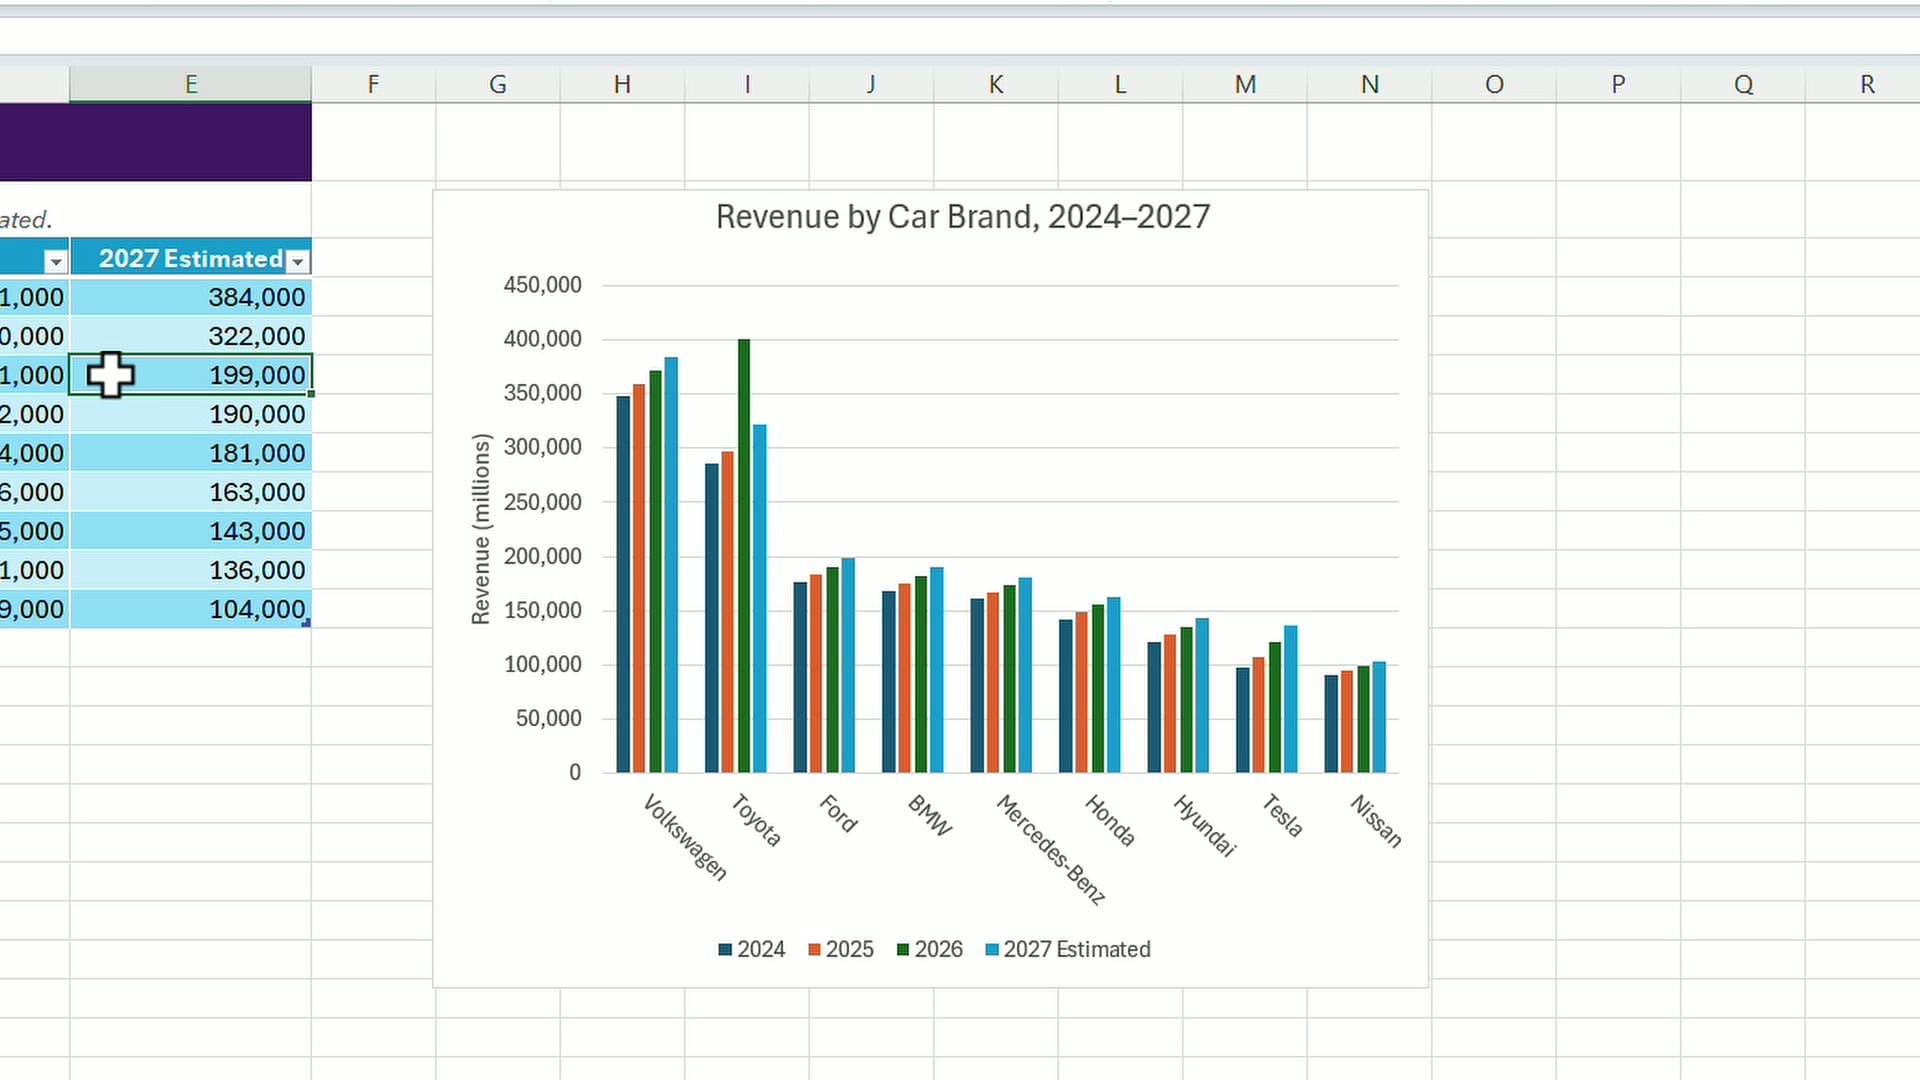
That is the boundary worth remembering. Copilot Vision reads your screen — it does not drive your mouse. But the walkthrough it gave was accurate. I asked how to turn the column chart into a bar chart, and it told me: click the chart to select it, go to the Chart Design tab at the top, click Change Chart Type, choose Bar from the list, pick the style you want, and click OK.
If you want hands-on editing rather than spoken instructions, that is a job for Copilot inside Excel itself, not for Copilot Vision.
Seven things that make the answers better
- Get the entire range on screen before you ask anything. Scroll up and zoom out.
- Describe the layout in one sentence: which worksheet, table or range, where the headers are, where the data starts and ends.
- Name the year or the column in every question. Do not make it guess which one you mean.
- Ask for the label and the number together — “which brand, and how much.”
- Give it permission to say it cannot do something.
- Interrupt when it starts narrating working you do not need.
- Spot-check anything you are going to act on. It was right every time here, but it will not always be.
It is not only for Excel
None of this is Excel-specific. Copilot Vision works with whatever is on your screen — a PowerPoint deck, a web page, a PDF, a dashboard. Excel is just a demanding test, because a wrong number is obvious in a way that a vague summary is not.
I normally talk to Copilot while I am driving to work, asking about my day and my meetings. Being able to do the same thing at the desk, with a document open in front of both of us, turns out to be just as useful. If you have used voice prompts inside Excel, this is the next step up: the same hands-free input, but now Copilot can see what you are talking about.
One note on access: this lives in Copilot Chat on the desktop, and what you see depends on your licensing. If you are not sure which version you have, here is how to tell a paid Microsoft 365 Copilot license from free Copilot Chat.
Links
Related guides
 Chris Menard
 Chris Menard
 Chris Menard
 Chris Menard
 Chris Menard