How To Show Percentages In Stacked Column Chart In Excel

Posted on:  11/21/2021
How To Show Percentages In Stacked Column Chart In Excel

With a stacked column chart in Excel, you can view partial numbers, but what do you do when you want to show percentages? Excel's pie charts show percentages, but stacked column charts do not. We are going to use a mixed reference to create a column chart with percentages.
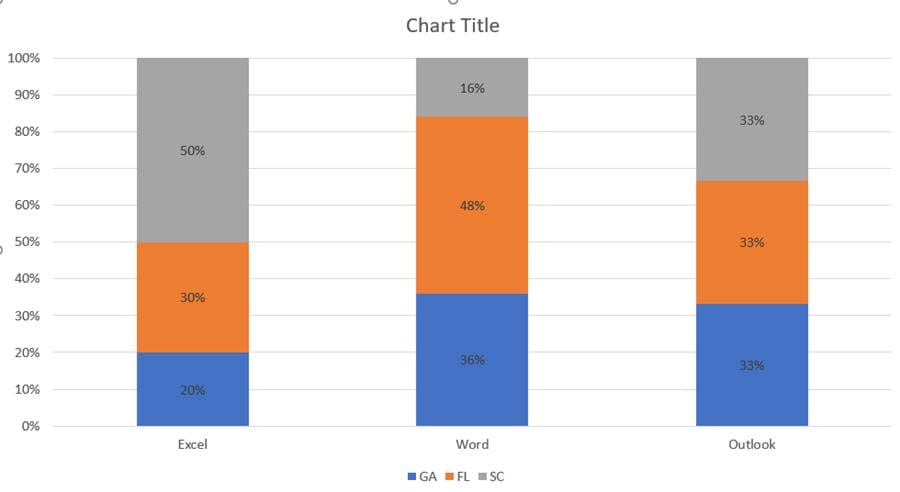
Stacked column chart with percentages in Excel

Stacked column chart with percentages in Excel

YouTube vdeo

Other Excel articles

Steps to create a stacked column chart with percentages

  1. Copy your data and paste somewhere else on your spreadsheet 3:26 in the video
  2. Select and remove the values and use a mixed reference to find the percentages 3:53 in the video
  3. Create a stacked column chart - 5:00 in the video

Recent Microsoft Teams articles

Blog Posts Week Starting February 17, 2025 - Snagit 2025, Teams NEW Feature, and Live Stream on Microsoft Copilot in Excel

Blog Posts Week Starting February 17, 2025 - Snagit 2025, Teams NEW Feature, and Live Stream on Microsoft Copilot in Excel

4 Great NEW Microsoft Teams Features: November & December 2024

4 Great NEW Microsoft Teams Features: November & December 2024

Teams: Improved People Search - November 2024

Teams: Improved People Search - November 2024

Microsoft Teams: How to Add Your Name Pronunciation (NEW Feature - December 2024)

Microsoft Teams: How to Add Your Name Pronunciation (NEW Feature - December 2024)

Recent Microsoft Excel articles

Copilot in Excel - Ask Copilot Questions about Keyboard Shortcuts, Functions, and Steps

Copilot in Excel - Ask Copilot Questions about Keyboard Shortcuts, Functions, and Steps

Mastering Excel Slicers: A Comprehensive Guide

Mastering Excel Slicers: A Comprehensive Guide

Mastering Loan Amortization: A Comprehensive Guide to Understanding and Comparing Loans

Mastering Loan Amortization: A Comprehensive Guide to Understanding and Comparing Loans

Analyzing 50+ Years of Mortgage Rates in Excel: Insights and Trends

Analyzing 50+ Years of Mortgage Rates in Excel: Insights and Trends

Chris Menard

Chris Menard is a Microsoft Trainer (MCT) and works as a full-time Trainer at BakerHostetler - one of the largest law firms in the US. Chris runs a YouTube channel with 900+ technology videos that cover various tools such as Excel, Word, Zoom, Teams, Gmail, Copilot, Google Calendar, and Outlook. To date, the channel has helped over 20 million viewers. Menard also does 2 to 3 public speaking events yearly, presenting at the Administrative Professional Conference (APC), the EA Ignite Conference, the University of Georgia, and CPA conferences. You can connect with him on LinkedIn at https://chrismenardtraining.com/linkedin or watch his videos on YouTube at https://chrismenardtraining.com/youtube.

Categories