Mastering Excel Slicers: A Comprehensive Guide

Excel slicers are powerful tools that enhance data filtering in Microsoft Excel, making it easier to visualize and analyze your data. In this blog, we will explore how to create and effectively use slicers, as well as their advantages and limitations in comparison to traditional filters.
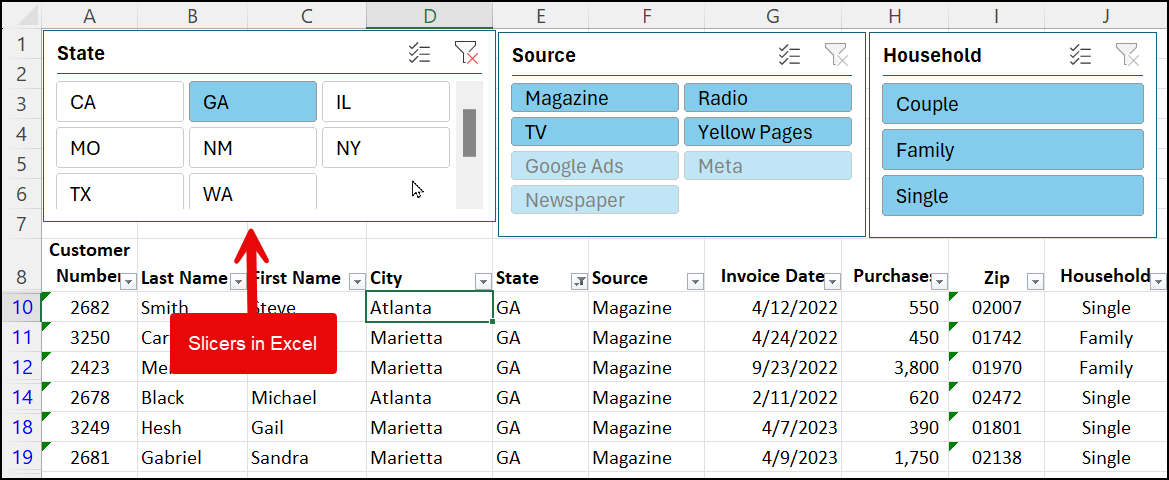
Excel slicers are powerful tools that revolutionize data filtering and analysis. They provide an intuitive, visual way to interact with your data, making it easier to extract meaningful insights quickly.
Slicers work exclusively with Excel tables, offering a more dynamic and user-friendly alternative to traditional filters. They allow you to slice and dice your data with just a few clicks, providing instant visual feedback on your selections.
Key Benefits of Excel Slicers
- Enhanced visual representation of filters - Quick and easy data segmentation - Improved data analysis capabilities - Better collaboration and presentation of filtered data
Understanding Slicers and Filters
While both slicers and filters serve the purpose of data refinement, they have distinct characteristics and use cases. Understanding these differences is crucial for leveraging the full potential of Excel slicers.
Slicers vs. Traditional Filters
- Visibility: Slicers provide clear visual cues about which data is being filtered, unlike traditional filters, which can be less noticeable. - Interactivity: Slicers offer a more interactive experience, allowing for quick toggling between different filter selections. - Scope: Slicers work only with tables, while filters can be applied to ranges and tables. - Data Types: Slicers are most effective with text fields, whereas filters work well with all data types, including numbers and dates.
One significant advantage of slicers is their ability to show selected and unselected data points. This feature is particularly useful in meetings or presentations where you need to quickly demonstrate what data is being excluded from your current view.
YouTube Video - Slicers in Excel
Excel: How & When to use Slicers - YouTube
Excel Slicers
Creating and Customizing Slicers
To harness the power of Excel slicers, you need to know how to create and customize them effectively. Here's a step-by-step guide to get you started:
Step 1: Create a Table
Before you can add slicers, your data must be in an Excel table. To create a table:
1. Select your data range 2. Press Ctrl+T or go to Insert > Table 3. Ensure "My table has headers" is checked if applicable 4. Click OK
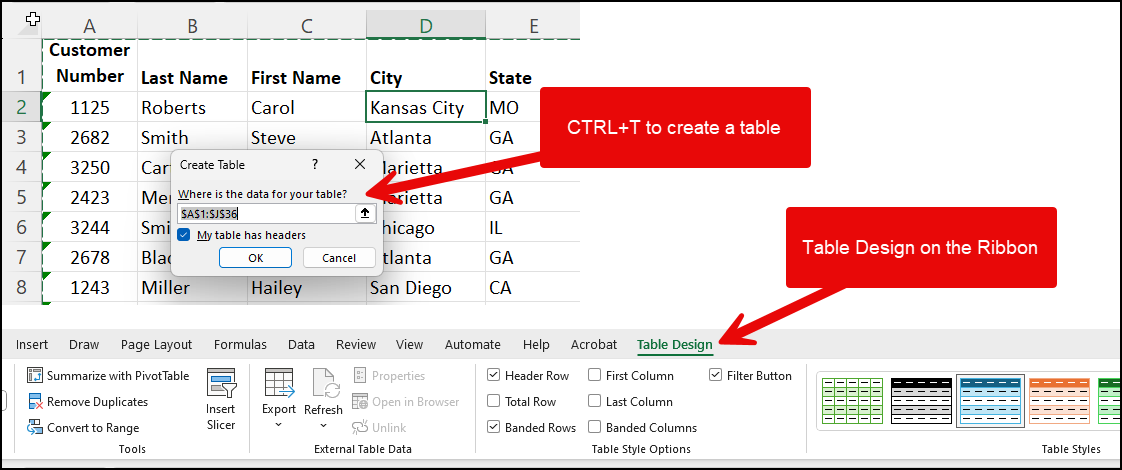
Create a Table in Excel
Step 2: Insert Slicers
Once your data is in a table format, you can add slicers:
1. Click anywhere in your table 2. Go to Table Design > Insert Slicer 3. Select the fields you want to create slicers for 4. Click OK
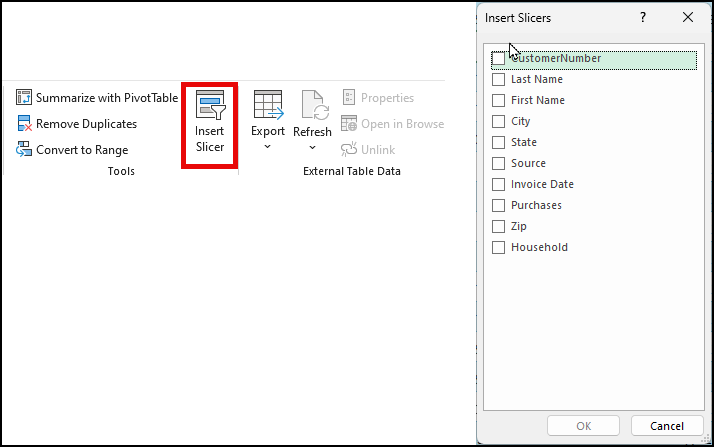
Insert Slicer
Step 3: Customize Slicer Appearance
To make your slicers more visually appealing and functional:
1. Resize slicers by dragging their borders 2. Move slicers by clicking and dragging them to desired locations 3. Change the number of columns in a slicer using the Slicer Tools > Options > Columns setting 4. Modify slicer styles using the Slicer Tools > Options > Slicer Styles gallery
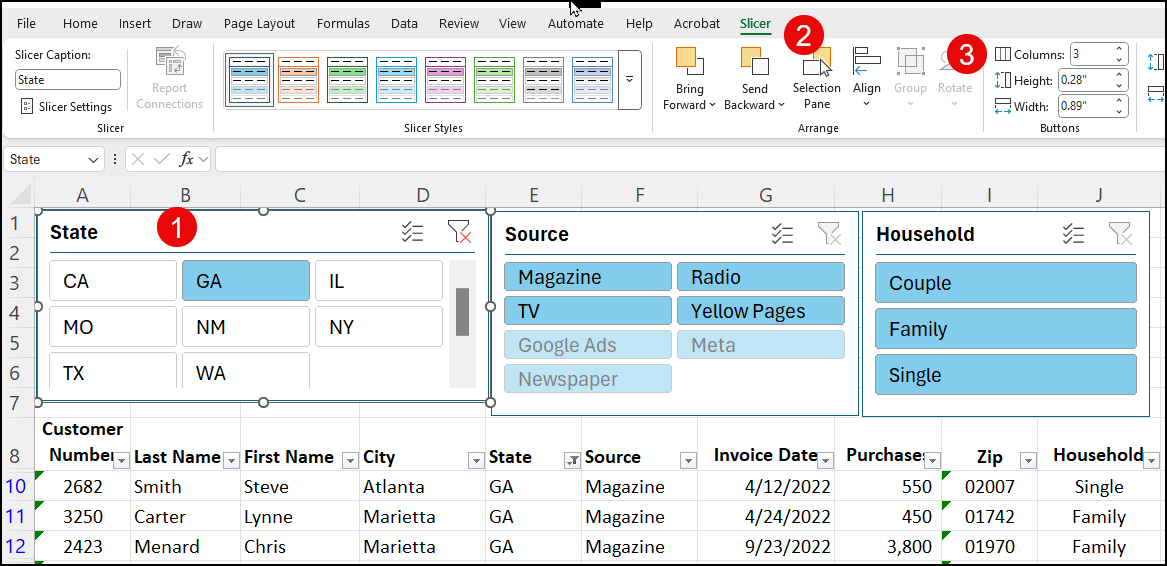
Slicer Tab in Excel
Using Slicers Effectively
To maximize the benefits of Excel slicers, it's important to understand how to use them efficiently. Here are some key techniques:
Single and Multiple Selections
Slicers allow for both single and multiple-item selections:
- Click on an item to select it individually - Hold Ctrl while clicking to select multiple items - Use the "Multi-Select" option (Alt+S) to invert your selection logic
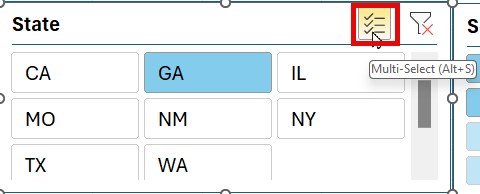
Slicers - Multi-Select (Alt+S)
Clearing Filters
To reset your data view, you can clear slicer selections in two ways:
- Click the funnel icon in the top-right corner of the slicer - Use the "Clear Filter" button in the Slicer Tools > Options ribbon
Combining Slicers with Traditional Filters
For more complex data analysis, you can use slicers in conjunction with traditional filters. This is particularly useful when dealing with numeric or date fields that are better handled by conventional filters.
Advanced Slicer Techniques
As you become more comfortable with Excel slicers, you can explore advanced techniques to enhance your data analysis capabilities:
Slicer Placement for Printing
When working with large datasets that span multiple columns, consider placing slicers at the top of your worksheet. This ensures they remain visible when printing, regardless of how far your data extends horizontally.
Using Multiple Columns in Slicers
For slicers with many items, increase readability by adjusting the number of columns:
1. Select the slicer 2. Go to Slicer on the Ribbon 3. Adjust the "Columns" setting to your desired number
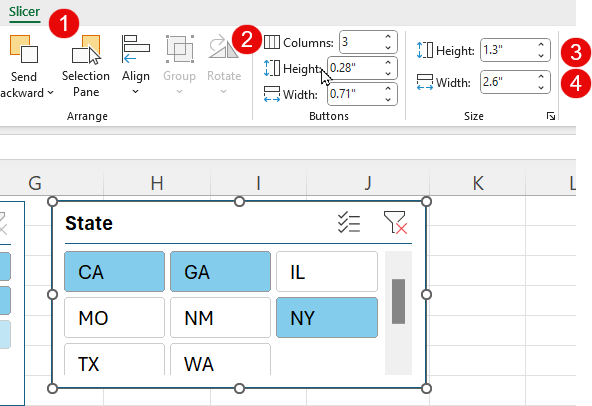
Slicer Buttons and Size - 1) Slicer tab. 2) Columns set to "3". 3) Height changed 4) Width changed
Adding and Managing Slicers
As your data analysis needs evolve, you may need to add, remove, or modify your Excel slicers. Here's how to manage them effectively:
Adding New Slicers
To add more slicers to your existing setup:
1. Select any cell in your table 2. Go to Table Design > Insert Slicer 3. Choose the additional fields you want to create slicers for 4. Click OK
Resetting Data After Removing Slicers
If you've removed slicers but your data is still filtered, you can quickly reset it:
1. Go to the Data tab in the ribbon 2. Click on "Clear" in the Sort & Filter group
By mastering these techniques for adding and managing Excel slicers, you'll be able to adapt your data analysis tools quickly as your needs change. Remember, the key to the effective use of slicers is to balance their visual appeal with their practical functionality in your specific data context.
Removing Slicers and Using Filters
While Excel slicers offer powerful visual filtering capabilities, there may be times when you need to remove them or revert to traditional filters. Here's how to manage this transition effectively:
Removing Individual Slicers
- Click on the slicer and press the Delete key - Right-click on the slicer and choose "Remove Slicer"
Removing Multiple Slicers at Once
To remove several slicers simultaneously:
1. Hold down the Ctrl key while selecting multiple slicers 2. Press Delete to remove all selected slicers at once
Resetting Data After Removing Slicers
If your data remains filtered after removing slicers, follow these steps:
1. Go to the Data tab in the Excel ribbon 2. Click on "Clear" in the Sort & Filter group
This action will reset your data view, removing any lingering filters.
Mixing Filters and Slicers
Excel slicers excel at handling text-based data, but they have limitations with numeric and date fields. In these cases, combining traditional filters with slicers can provide a more comprehensive data analysis solution.
When to Use Traditional Filters
- Numeric Data: Use filters for operations like "Greater Than," "Less Than," or specific value ranges - Date Fields: Filters are ideal for selecting date ranges or specific time periods
Combining Filters and Slicers
To leverage both tools:
1. Use slicers for categorical data (e.g., product types, regions) 2. Apply traditional filters to numeric or date columns 3. Ensure your table has the filter option enabled (Table Design > Header Row)
This combination allows you to slice your data categorically while applying precise numeric or date-based criteria.
Advanced Slicer Tips
To truly master Excel slicers, consider these advanced techniques:
Multi-Column Slicers
For slicers with numerous items:
1. Select the slicer 2. Go to Slicer Tools > Options 3. Adjust the "Columns" setting (e.g., 2 or 3 columns)
This improves readability and reduces vertical scrolling.
Using Multi-Select Mode
Enable Multi-Select for a different selection behavior:
- Click the Multi-Select button or use Alt+S - All items are selected by default - Click items to deselect them
This mode is particularly useful when you want to exclude specific items from your data view.
Syncing Slicers Across Worksheets
To apply slicer filtering across multiple worksheets:
1. Create slicers on one sheet 2. Right-click a slicer and choose "Report Connections" 3. Select the tables or pivot tables you want to connect
This ensures consistent filtering across your entire workbook.
Printing Slicers and Final Tips
When preparing your Excel workbook for printing or presentation, consider these tips for optimal slicer usage:
Strategic Slicer Placement
To ensure slicers are visible when printing extensive datasets:
1. Insert several rows at the top of your worksheet 2. Place your slicers in these rows above your data 3. Arrange slicers horizontally for better visibility
This placement guarantees that your slicers will always be visible, regardless of how far your data extends horizontally.
Optimizing Slicer Layout
For a cleaner, more professional look:
1. Align slicers neatly using Excel's alignment tools 2. Adjust slicer widths to be consistent where possible 3. Use a consistent style across all slicers for visual cohesion
Slicer Styles for Clarity
Enhance the visual appeal and clarity of your slicers:
1. Select your slicer 2. Go to Slicer Tools > Options 3. Explore different styles in the Slicer Styles gallery 4. Choose a style that complements your workbook's overall design
Frequently Asked Questions (FAQ)
Q: Can I use slicers with any Excel data?
A: Slicers only work with Excel tables or PivotTables. You'll need to convert your data range into a table before you can use slicers.
Q: How many slicers can I add to a single table?
A: There's no set limit to the number of slicers you can add. However, for practical purposes, it's best to use only the most relevant slicers to avoid cluttering your worksheet.
Q: Can I use slicers with dates or numeric data?
A: While you can create slicers for date or numeric fields, they're most effective with text-based categorical data. For dates and numbers, traditional filters or PivotTable timelines often provide better functionality.
Q: How do I sync slicer selections across multiple worksheets?
A: You can connect a slicer to multiple tables or PivotTables across different worksheets. Right-click the slicer, choose "Report Connections," and select the tables or PivotTables you want to link.
Q: Can I customize the appearance of my slicers?
A: Yes, Excel offers various styling options for slicers. You can change their color scheme, adjust the number of columns, resize them, and more using the Slicer Tools options in the ribbon.
By leveraging these advanced techniques and understanding the nuances of Excel slicers, you can significantly enhance your data analysis capabilities and create more dynamic, interactive spreadsheets.


