Five Methods for Creating Running Totals in Excel

Excel is a powerful tool that offers various features to manipulate and analyze data efficiently. One of the useful functionalities it provides is the ability to create running totals, which can be essential for tracking cumulative sums over a period. This capability can be particularly beneficial in scenarios like financial tracking, inventory management, or even in monitoring task completions. Understanding how to effectively utilize Excel to generate running totals can save you time and improve your data analysis skills. In this part of the blog, we will explore five different methods to create running totals in Excel. Each method caters to different needs and offers unique advantages. Whether you are a beginner or an advanced user, you will find these techniques valuable for your Excel tasks.
Method 1: Quick Analysis Feature
One of the simplest and fastest ways to create running totals in Excel is by using the Quick Analysis feature. This method is especially useful for those who prefer a straightforward approach without getting into formulas right away. Here's how to use it:
- Start by selecting the range of data for which you want to calculate the running total. - After selecting your data, look for the Quick Analysis button that appears at the bottom right of the selected range. Clicking on this button will open a small menu filled with analysis options. - Within the Quick Analysis menu, click on the ‘Totals’ option. You will see various total calculations available for your data. - Navigate through the options until you find the ‘Running Total’ feature, which might be represented by an icon or label. This feature is usually highlighted in a different color or marked distinctly. - Hovering over the ‘Running Total’ option will preview the running totals directly in your spreadsheet. If the preview matches your expectations, click on it to apply the running total to your data. - Once applied, Excel will automatically generate the running total for your selected range and display it alongside or below your initial data.
This method is incredibly user-friendly and does not require any prior knowledge of Excel formulas. It is perfect for quick tasks where you need to see a running total without permanent formula implementation.
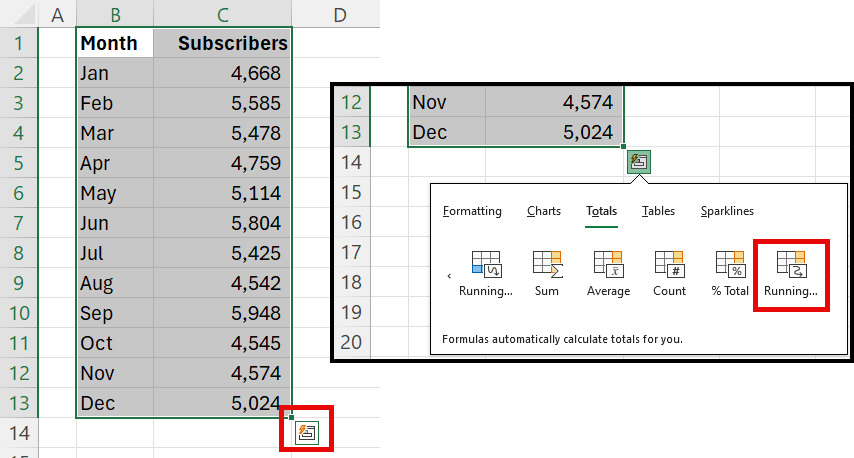
Excel Quick Analysis for Running Totals
YouTube Video - Running Totals - Five methods
5 Methods for Running Totals in Excel - YouTube
Method 2: Manual Formula Entry
Another way to create running totals in Excel is by manually entering formulas. This method gives you more control over the calculation process and is perfect when you want to understand the mechanics behind the calculations. Let's dive into how you can do this:
Step-by-Step Guide
- First, identify the column that contains the numbers you wish to accumulate. For example, if you're tracking monthly sales, select the column that lists sales figures.
- Next, in the cell adjacent to your first value (or in a new column), enter a formula that references the first cell in your series. This cell will serve as the starting point for your running total.
- To continue, in the cell directly below the one with your initial formula, type in a formula that adds the above cell to the next cell in your series. Ensure the first cell reference in your formula is fixed (absolute reference). This can be done by adding dollar signs ($) before the column letter and row number of your first cell reference in the series.
- Once you've entered the formula, drag it down to fill the cells below. Excel will automatically adjust the formula to reference the correct cells, keeping the first cell reference fixed and creating a running total as you go.
Manually entering formulas for running totals is a bit more labor-intensive but offers a clear understanding of how Excel calculates these totals. Plus, it allows for adjustments and customizations that automated methods might not support.
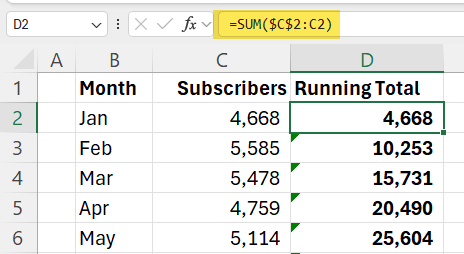
Excel Running Total - SUM Function with Absolute Reference
Method 3: Using the SUM Function
Utilizing the SUM function is another efficient approach for generating running totals in Excel. This method is straightforward but powerful, allowing for dynamic updates to your running totals as your data changes. Here’s how you can implement it:
Steps to Follow
- Identify the column where you want the running totals to appear. This column should be adjacent to or near the data you're summing up. - In the first cell of your chosen column (for the running total), input the SUM function to add up the first value of your data set. This will be the base of your running total. - For the next cell down in your running total column, modify the SUM function to include the range from the first data cell to the current row's data cell. This creates the cumulative effect needed for a running total. - Continue this pattern down the column, expanding the range in the SUM function by one row each time. This can be done quickly by dragging the fill handle (a small square at the bottom right corner of the cell) down, which automatically adjusts the formula for each cell.
Using the SUM function for running totals is versatile and reliable. It ensures that your totals are always up to date, reflecting any additions or changes to your data set. This method is particularly useful for financial analyses, inventory tracking, or any scenario where monitoring cumulative totals is crucial.
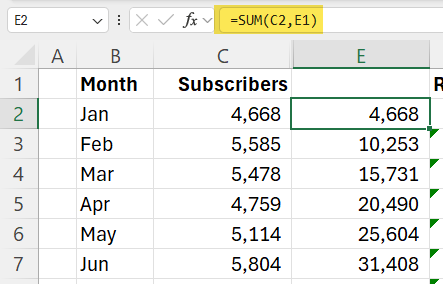
Excel running total with Sum function
Method 4: Using the SCAN Function
For those who have access to Microsoft Excel 365, M365 for Windows, Mac, or Web, the SCAN function offers an innovative way to create running totals. This method is particularly useful for users who prefer leveraging the latest functionalities provided by Excel. Here's how you can utilize the SCAN function:
Step-by-Step Guide
- First, open your Excel spreadsheet and select the cell where you want your running totals to begin.
- Type in the SCAN function formula: `=SCAN(0, yourArray, LAMBDA(accumulator, currentValue, SUM(accumulator, currentValue)))`. Replace `yourArray` with the range of cells that contain the data you wish to accumulate.
- The first argument '0' signifies the initial value of the running total. The array is the range of your data, and the LAMBDA function is used to apply the SUM function iteratively across your data range.
- After entering the formula, press Enter. Excel will automatically calculate the running totals using the SCAN function and display the results starting from your selected cell.
- Drag the fill handle down if you wish to copy the formula to other cells.
This method is efficient and reduces the complexity involved in creating dynamic running totals. It's a testament to the power of Excel 365's new functions, making complex calculations more accessible to everyday users.
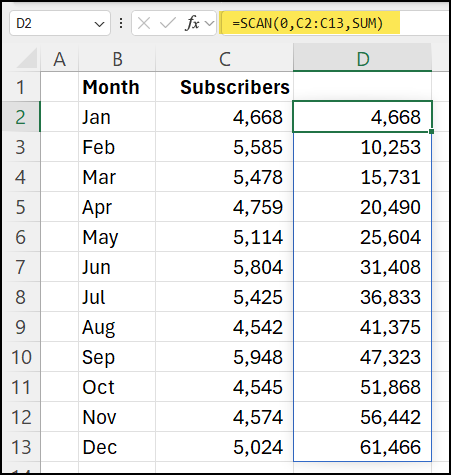
SCAN Function in Excel for running total
Method 5: Creating a Pivot Table
Creating a Pivot Table is another powerful and dynamic method to generate running totals in Excel. This approach is especially beneficial for users who work with large datasets and require a method that not only provides running totals but also offers flexibility in data analysis. Here's how to create running totals using a Pivot Table:
Steps to Follow
- Start by selecting the range of data you want to analyze. Ensure your data range includes all the values for which you need running totals. - Go to the ‘Insert’ tab on the Ribbon and click on ‘PivotTable’. Choose whether you want the Pivot Table report to be placed in a new worksheet or the existing one. - In the Pivot Table Field List, drag the field you want to accumulate into the ‘Rows’ area and again into the ‘Values’ area. This sets up your data for analysis. - Click on the value field in the Pivot Table, then select ‘Value Field Settings’. Navigate to ‘Show Values As’ tab and choose ‘Running Total In’. Select the field over which you want the running total to be calculated. - Press ‘OK’ to apply your settings. The Pivot Table will now display the running totals for your selected data range.
This method is not only straightforward but also incredibly versatile, allowing you to adjust your analysis and presentation of data effortlessly. Pivot Tables are a powerful feature for summarizing, analyzing, exploring, and presenting your data, making running totals just the tip of the iceberg in terms of capability.
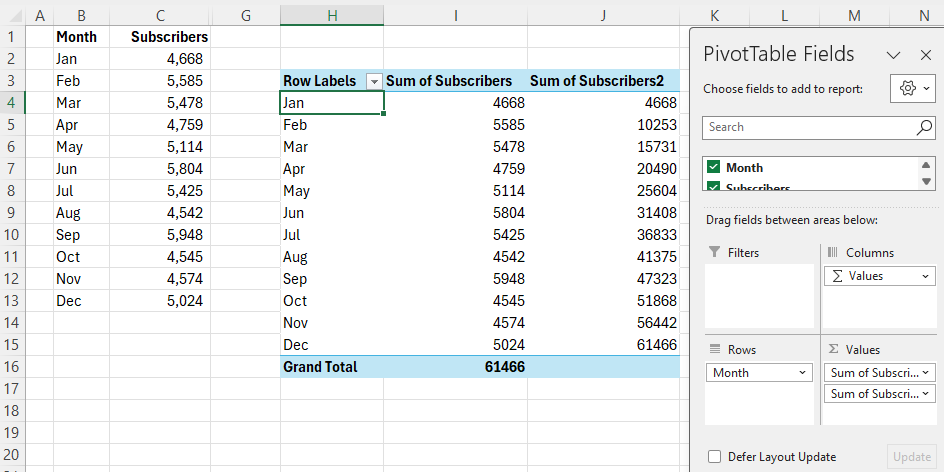
Excel running totals with a PivotTable


