Excel - How to use the Navigation pane for charts, tables, PivotTables, pictures, and worksheets

Posted on:  10/31/2021
Excel - How to use the Navigation pane for charts, tables, PivotTables, pictures, and worksheets

The Navigation pane in Excel is an easy way to understand a workbook's layout. With the Navigation pane, you can see charts, tables, images, and PivotTables. The Navigation Pane even shows you the elements by worksheet. 
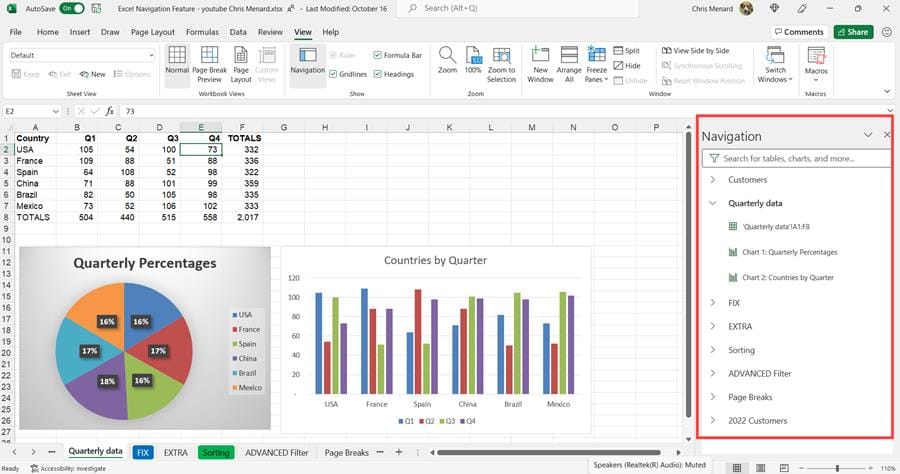
Navigation Pane in Excel

Navigation Pane in Excel - Worksheets show and elements on the worksheet

Clicking an element will take you directly to that element. The Navigation pane appears on the right side of your Excel file. It can be resized. To open the Navigation pane, have Excel open and click the View tab - Navigation pane, and it will open on the right side.

YouTube video

Other Excel articles

Open the Navigation Pane

  1. Click the View Tab.
  2. Click Navigation
Navigation Pane in Excel

Navigation Pane in Excel

Explore the elements

When the Navigation pane opens, you'll see a list of elements such as tables, named ranges, and other elements from this sheet. Each sheet within the workbook will be in its own section. Select a section to expand and display its contents.

Each section will show any tables, charts, PivotTables, and images located on the sheet. Selecting an element will move the focus to that element on the sheet.

If the element is on another sheet within the workbook, the focus will switch to the correct sheet and element.
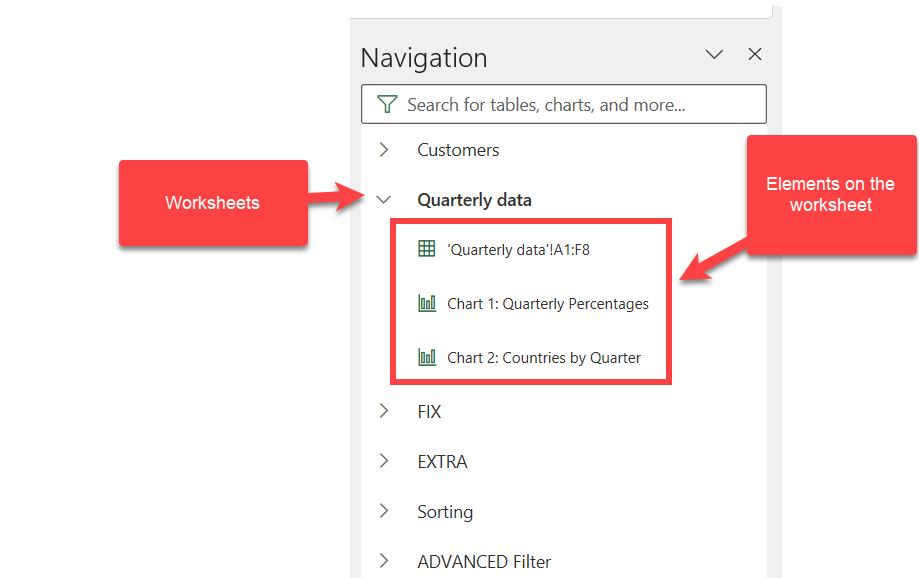
Elements in the Navigation Pane

Elements in the Navigation Pane

Other Excel articles

Excel 3D Reference - easily reference data on another worksheet

Excel 3D Reference - easily reference data on another worksheet

What is the Middle Class and Are You in the Middle Class?

What is the Middle Class and Are You in the Middle Class?

Excel - 3 Cool methods to extract text from the beginning of a text string

Excel - 3 Cool methods to extract text from the beginning of a text string

Artificial Intelligence (AI) in Microsoft 365

Artificial Intelligence (AI) in Microsoft 365

Analyze Data Command in Excel - Ask questions about your data using AI

Analyze Data Command in Excel - Ask questions about your data using AI

Excel - Easily Break Up Data using Subtotals and Conditional Formatting

Excel - Easily Break Up Data using Subtotals and Conditional Formatting

Chris Menard

Chris Menard is a Microsoft Certified Trainer (MCT) and is employed full-time as a Trainer for BakerHostetler, one of the nation’s largest law firms. Menard has a YouTube channel with over 900 technology videos covering Excel, Word, Zoom, Teams, Outlook, Gmail, Google Calendar, and other resources that over 16 million viewers have appreciated. Menard also does public speaking at conferences for CPAs and Administrative Professionals. Connect with Chris on LinkedIn at chrismenardtraining.com/linked or on YouTube at chrismenardtraining.com/youtube

Categories