Excel Copilot AGENT MODE: Build Dashboards and Apply Formatting Hands-Free


Microsoft is rolling out Agent Mode for Copilot in Excel, and it represents a major step forward from the standard Copilot experience. Agent Mode doesn't just suggest changes—it executes them directly, without requiring you to click Apply after every action. In this guide, we walk through where to find it, how to enable it, and what it can actually do with a real dataset of over 2,000 rows.
Where to Find Copilot in Excel
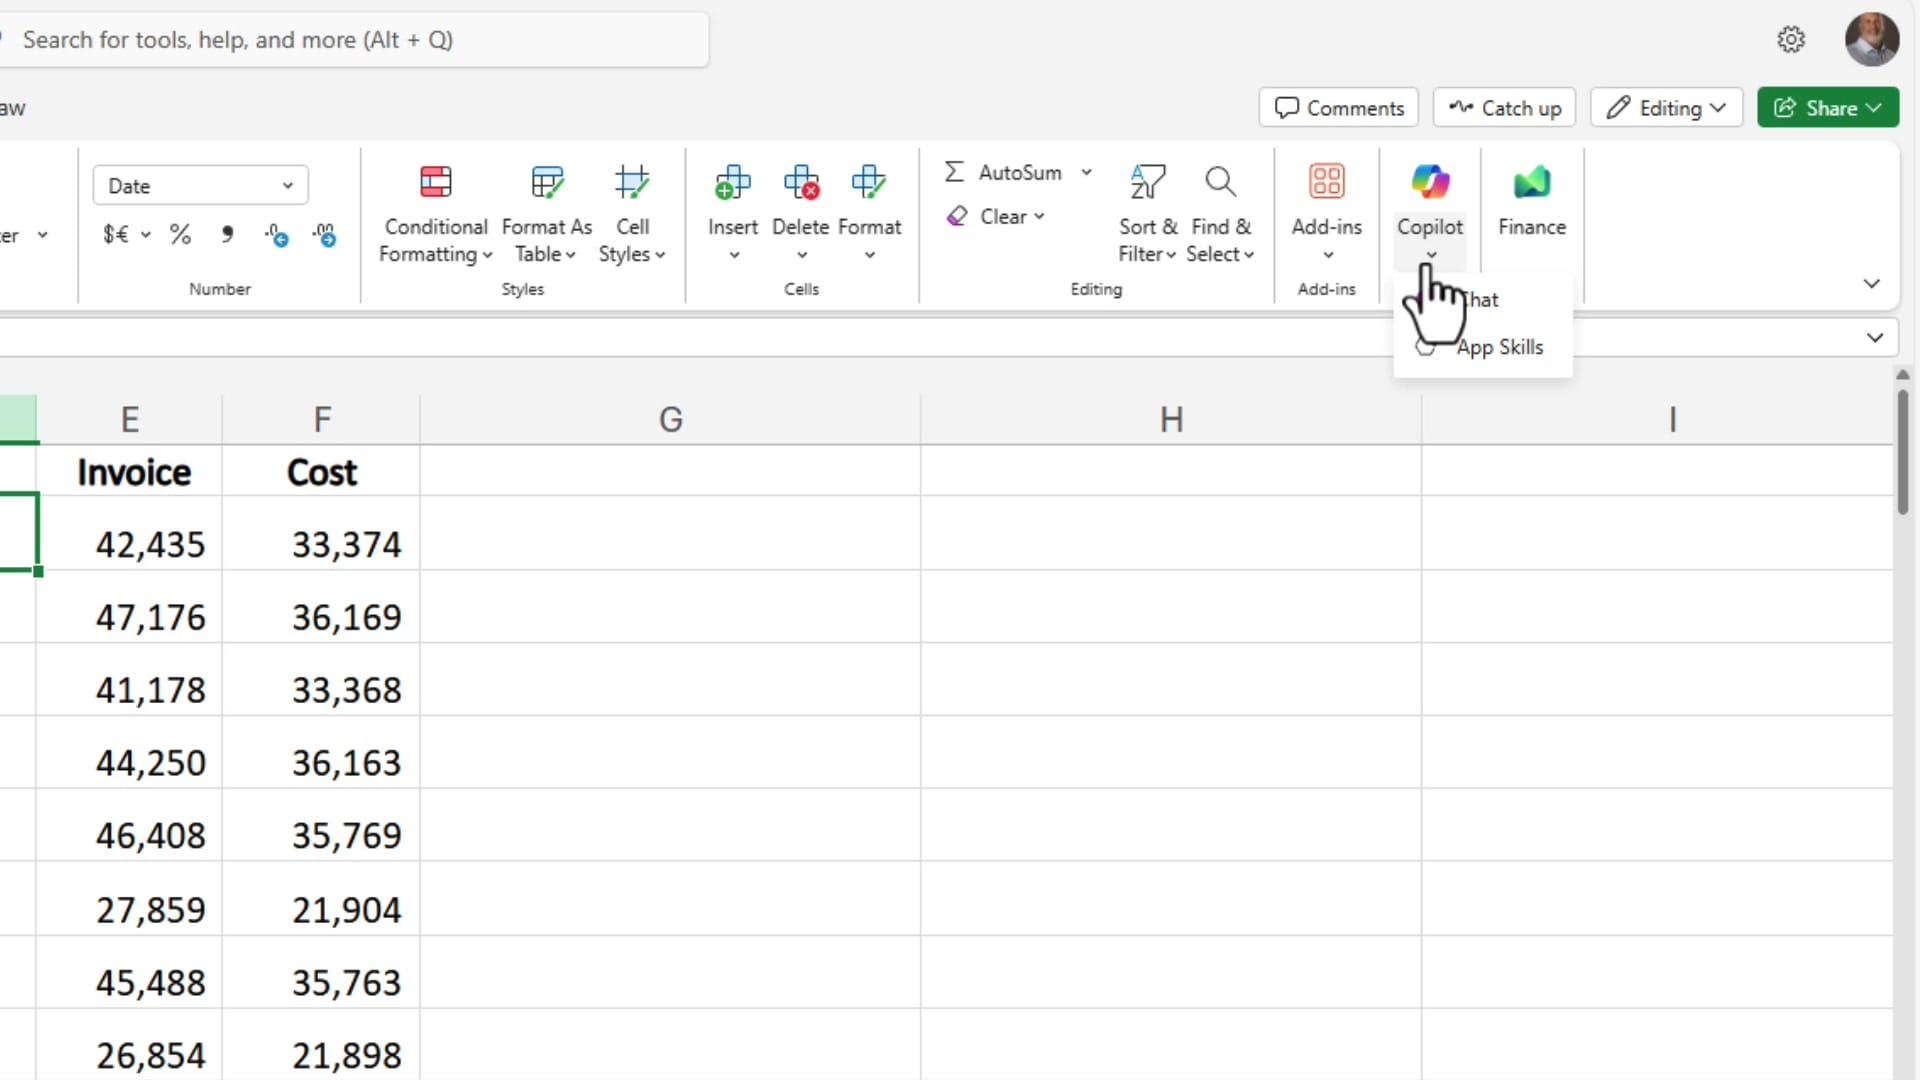
On Excel for the web, click the Copilot button in the ribbon. You'll see a dropdown with two options: Chat and App Skills. Chat lets you ask questions about your data, while App Skills handles actions like formatting and formula creation. Microsoft has confirmed this dropdown is being phased out—both options will merge into a single Copilot experience.
In the Chat panel, you can ask Copilot to analyze your workbook. For example, asking it to describe the data returns a detailed summary including row counts, column structure, date ranges, and insights about the dataset—useful for quickly understanding unfamiliar spreadsheets.
Switching to Excel Desktop and Update Channels
Agent Mode is currently available in Excel desktop on the Beta channel. If you're on the Monthly Enterprise or Semi-Annual Enterprise channel, you won't see it yet. To check your update channel, go to File > Account and look under Office Updates. The Beta channel gets features first, followed by the Current Channel, then the Monthly Enterprise, and finally the Semi-Annual.
This is a paid feature of Microsoft 365 Copilot. You need an active Microsoft 365 Copilot subscription to access Agent Mode.
File to download
Enable Agent Mode
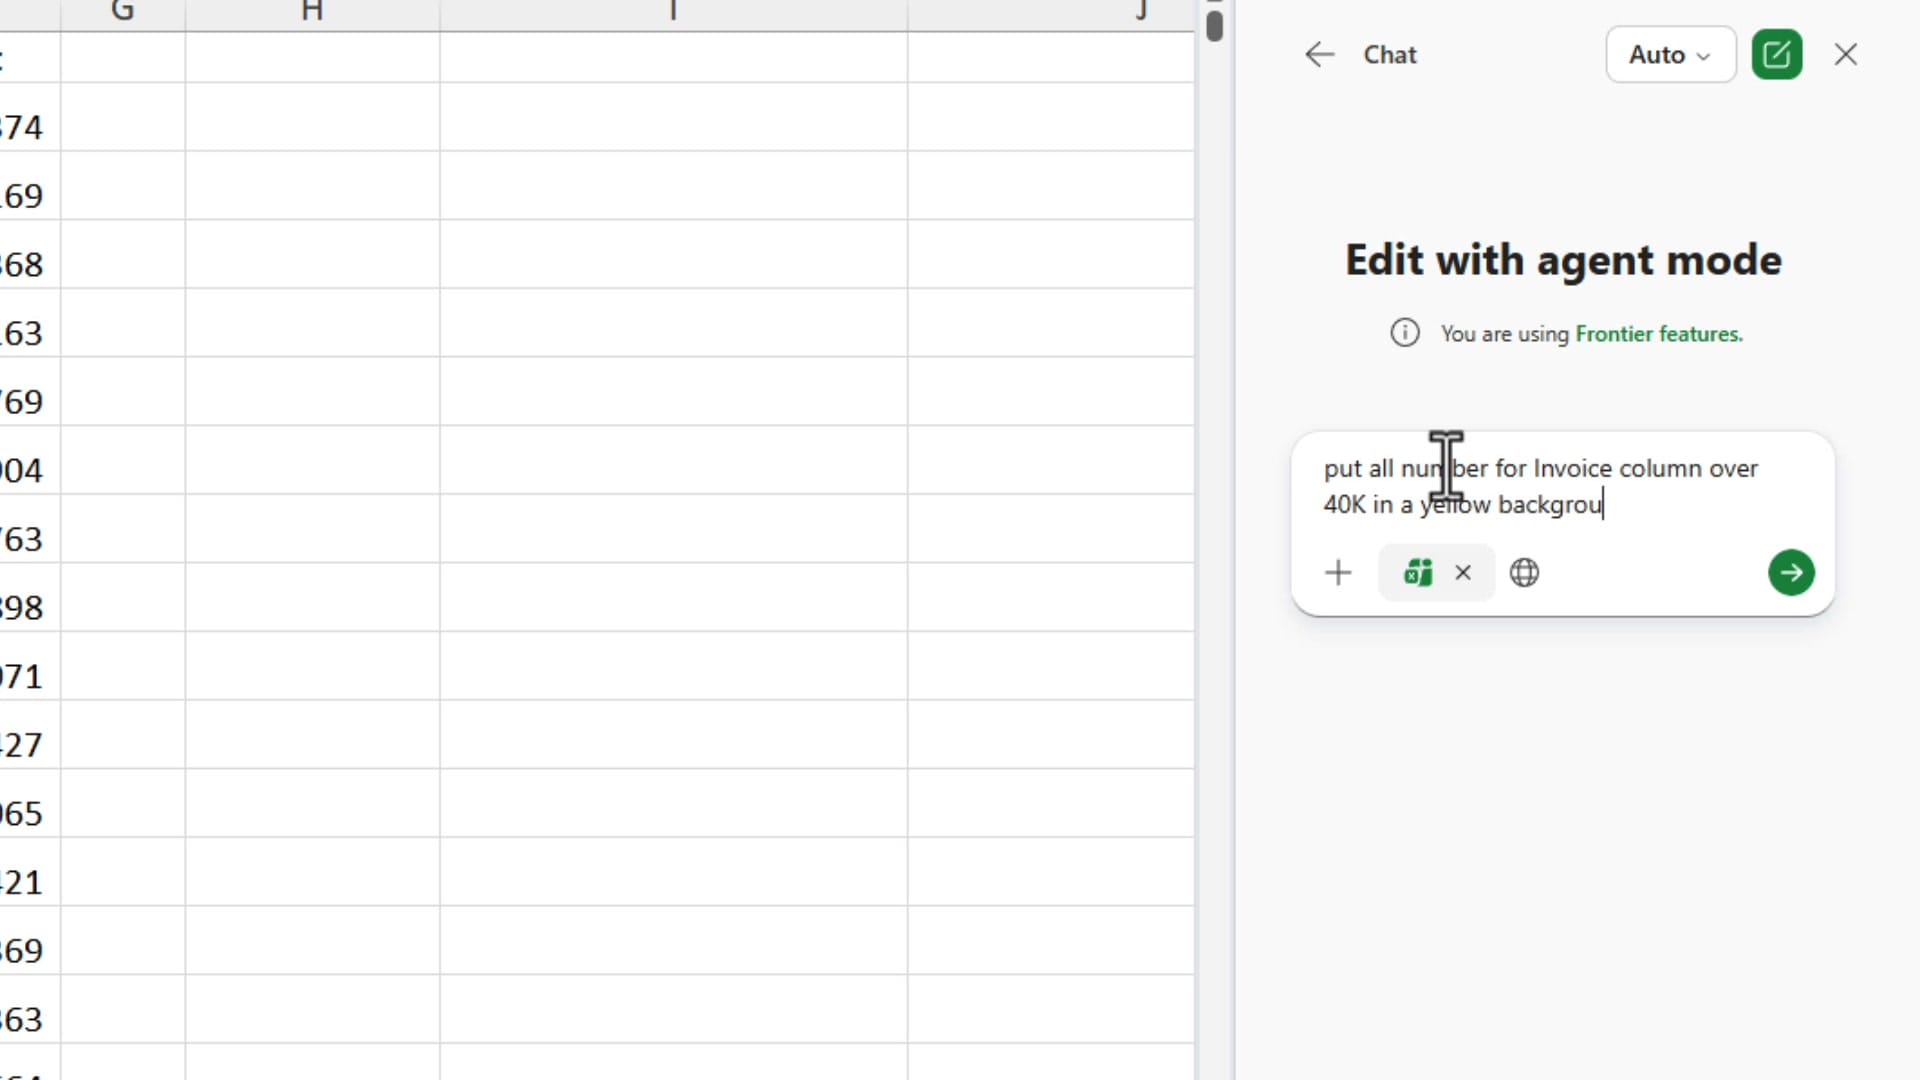
On the Excel desktop, click the Copilot button in the ribbon. At the top of the Copilot panel, you'll see a mode selector. Click it and choose Edit with agent mode. The panel changes to show "Edit with agent mode" as the header, along with a notice that you're using Frontier features.
The key difference from standard Copilot: Agent Mode applies changes directly to your workbook. Standard Copilot shows you a preview and waits for you to click Apply. Agent Mode just does it.
Apply Conditional Formatting with Agent Mode
To test Agent Mode, try a conditional formatting prompt. For example: "Put all numbers for the Invoice column over 40K in a yellow background." Agent Mode applies the formatting rule immediately across all 2,004 data rows without any additional confirmation steps.
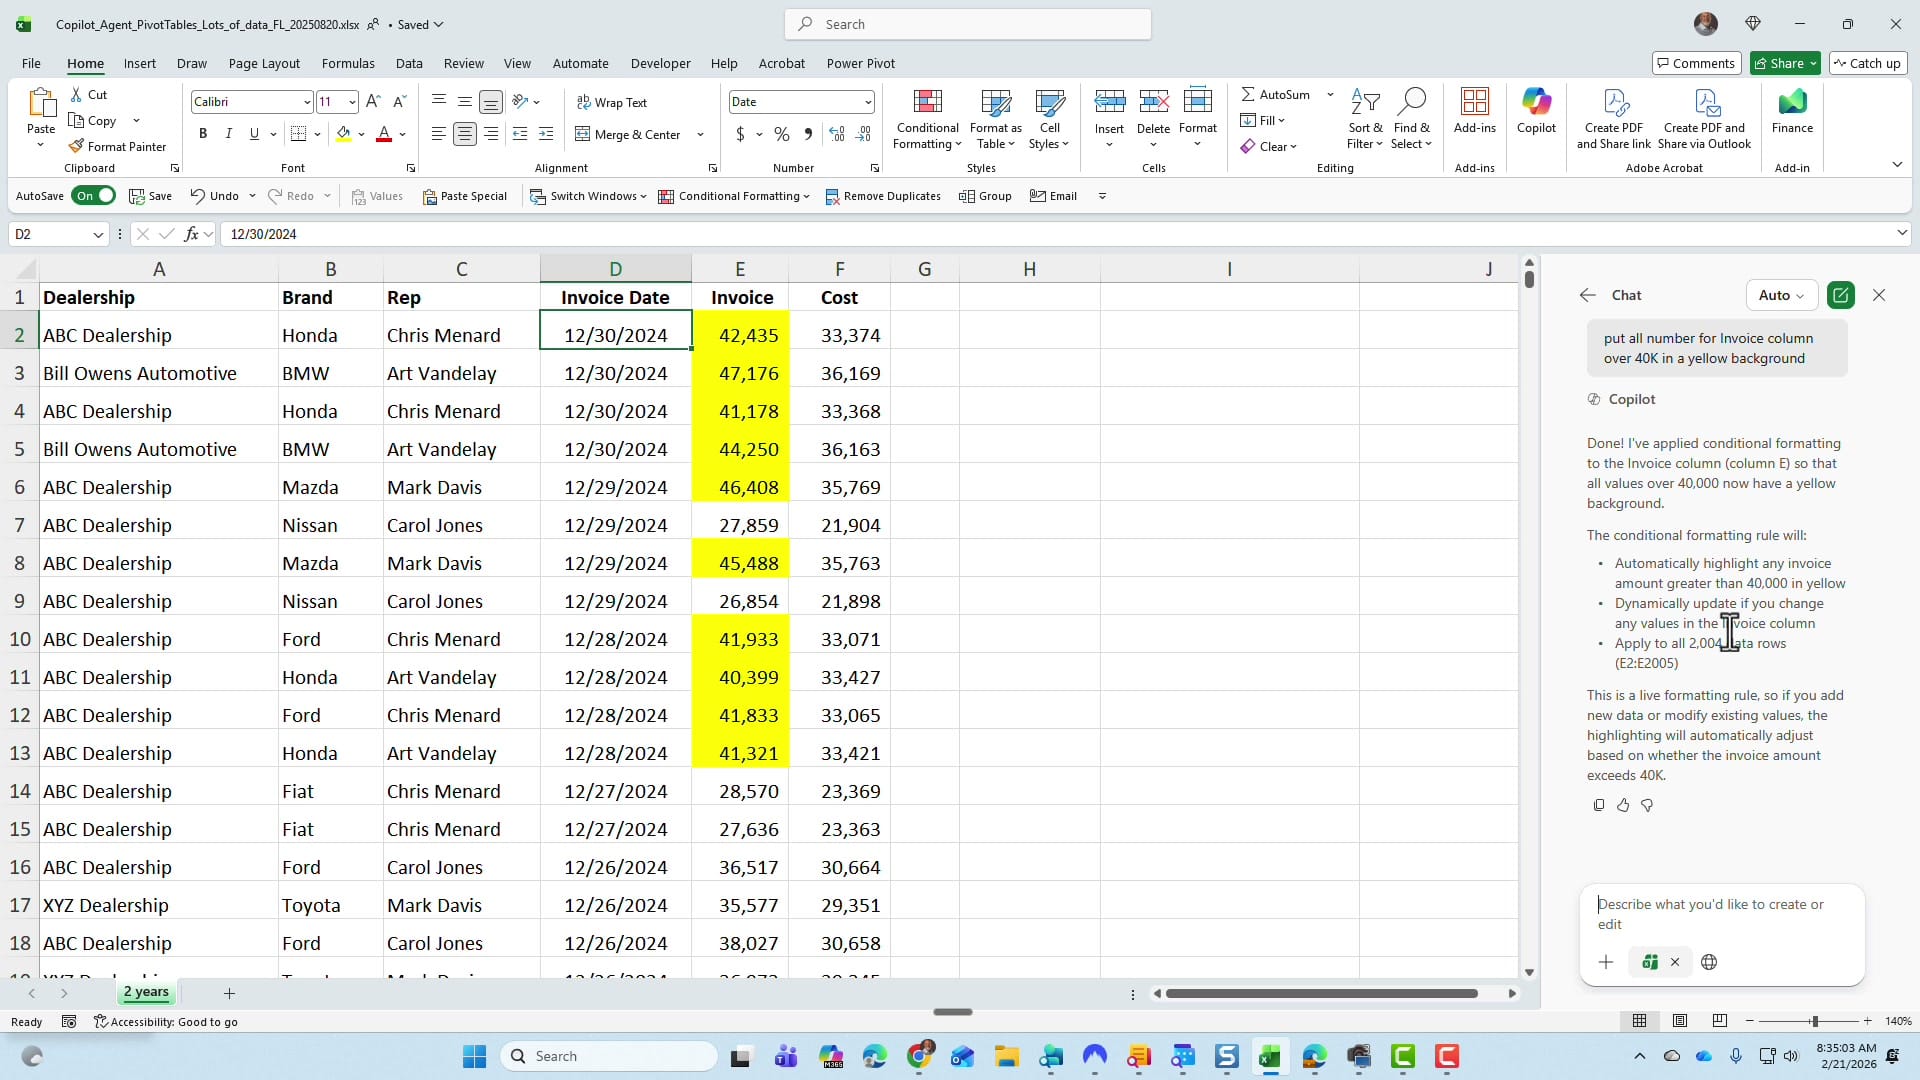
The conditional formatting rule is live, so if you add new data or modify existing values, the highlighting updates automatically. This is the same kind of conditional formatting you can do with standard Copilot, but Agent Mode skips the preview-and-confirm step entirely.
Select an AI Model in Agent Mode
Agent Mode lets you choose which AI model handles your request. Click the model dropdown at the top of the panel and you'll see three options:
- Auto — Microsoft selects the best model for the task
- GPT 5.2 — OpenAI's model
- Claude Opus 4.5 — Anthropic's model
This is the first time Microsoft has offered model choice inside a native Office application. For complex analytical tasks, you can experiment with different models to compare results.
Build a Full Dashboard with Agent Mode
The real power of Agent Mode shows when you ask it to handle complex, multi-step tasks. Using the prompt "Create a dashboard for me. I want to see charts and graphs and PivotTables," Agent Mode built a complete sales dashboard from scratch.
Starting from a raw dataset with columns for Dealership, Brand, Rep, Invoice Date, Invoice, and Cost—but no Profit column—Agent Mode:
- Created a calculated Profit column (Invoice minus Cost)
- Built a new Dashboard worksheet with Key Performance Indicators
- Generated revenue breakdowns by Brand, Dealership, and Sales Rep
- Created a Monthly Sales Trend table with Revenue and Profit columns
- Added pie charts (Revenue by Brand), bar charts (Revenue by Dealership), and donut charts (Transaction Count by Brand)
- Built a separate PivotTables worksheet with supporting data
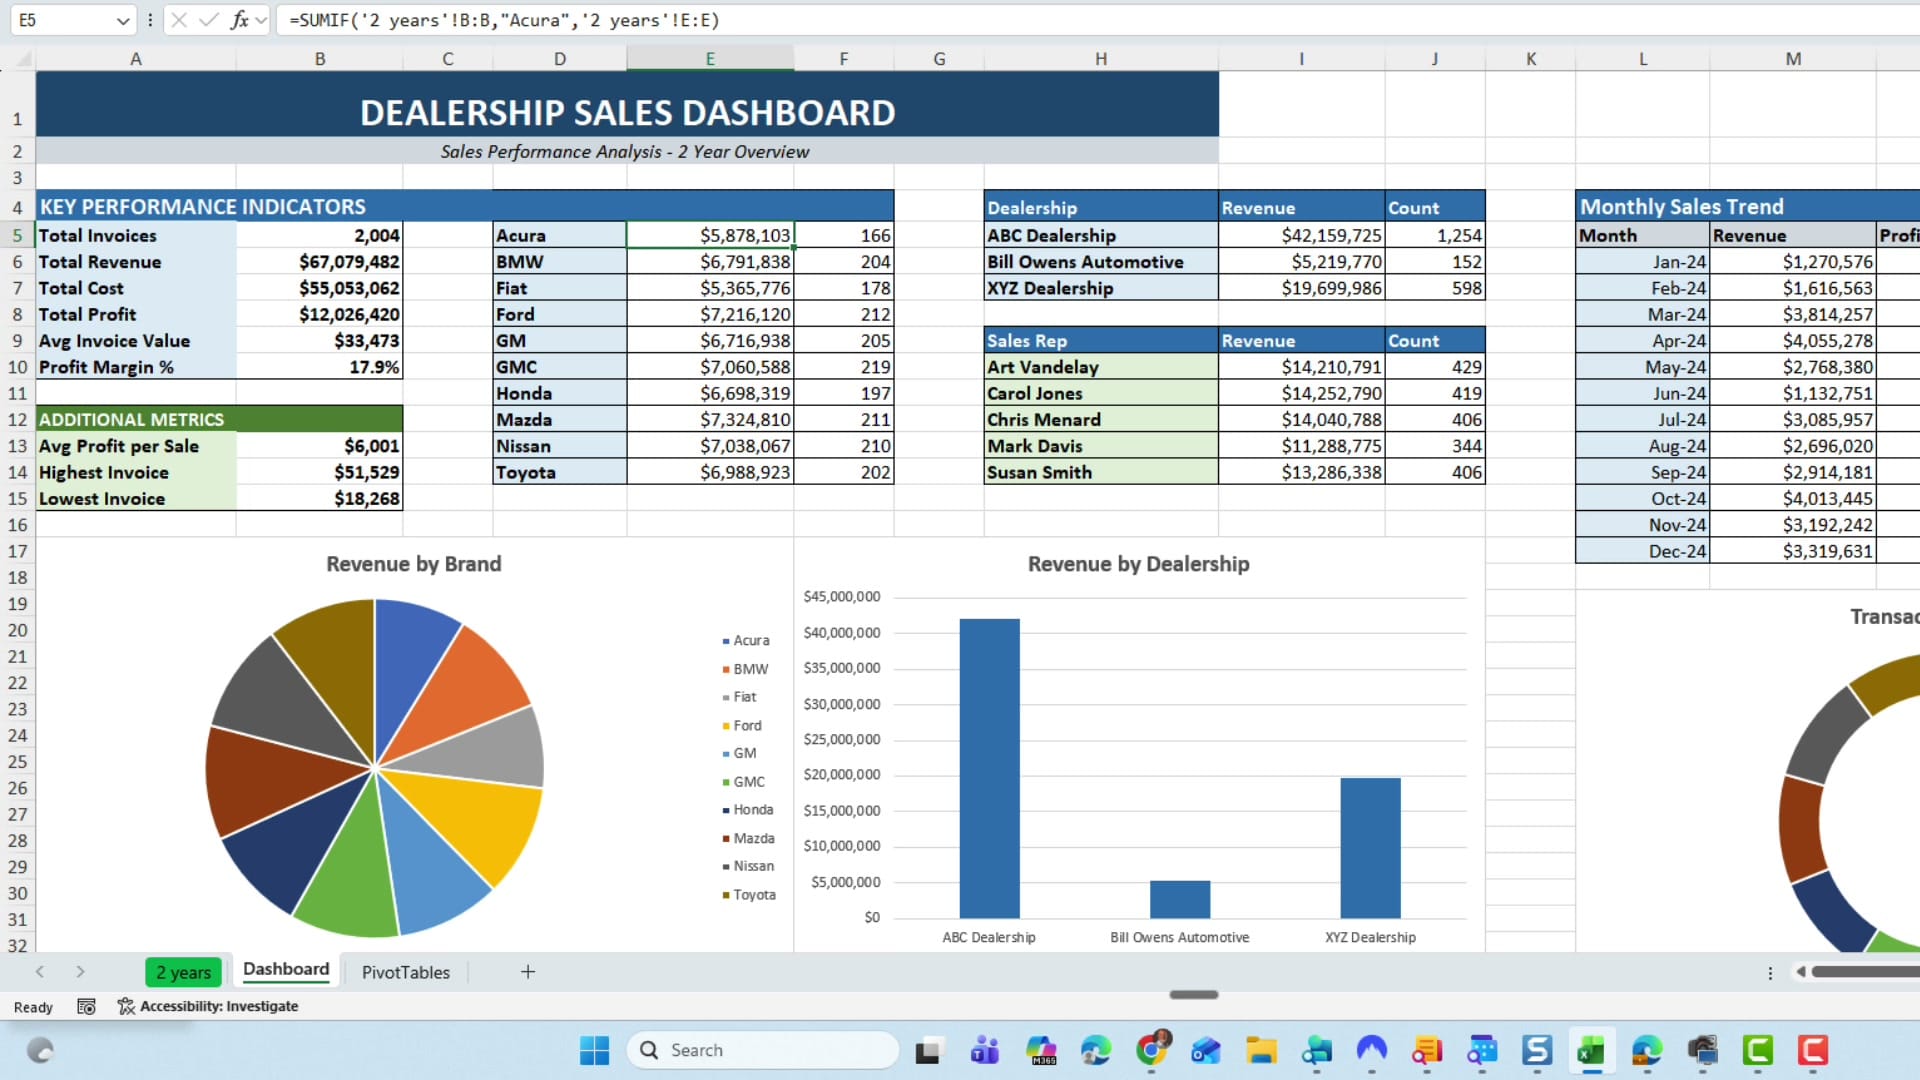
Key numbers from the dashboard: 2,004 total invoices, $67 million in total revenue, $55 million in total cost, $12 million in total profit, with a 17.9% profit margin. Agent Mode calculated all of these from the raw data, including creating the Profit column that didn't exist in the original dataset.
Verifying the Results
After Agent Mode builds something this complex, it's worth checking the numbers. The SUMIFS formulas in the dashboard reference the source data correctly. The monthly breakdown adds up to the totals. The profit margin calculation (Total Profit / Total Revenue) checks out at 17.9%.
One thing to note: the dashboard Agent Mode creates is functional but may benefit from some manual tweaking—adjusting chart colors, resizing elements, or adding your preferred number formats. Think of it as a strong first draft that gets you 80-90% of the way there.
Rollout Timeline
As of now, Agent Mode is available in:
- Excel for the web — rolling out now
- Excel desktop (Beta channel) — available now
- Current Channel / Monthly Enterprise — expected soon
- Semi-Annual Enterprise — typically 6+ months behind Beta
If you don't see Agent Mode yet, check your update channel and ensure your Microsoft 365 Copilot license is active. The paid Copilot license is required—the free Copilot Chat does not include Agent Mode.
Related guides
 Chris Menard
 Chris Menard
 Chris Menard
For anyone who regularly builds reports or dashboards in Excel, Agent Mode is worth learning now. The ability to go from raw data to a complete dashboard with a single prompt—and have it executed without clicking Apply for each step—makes complex Excel tasks significantly faster.