Excel - 3 Methods to Shade Every Other Row

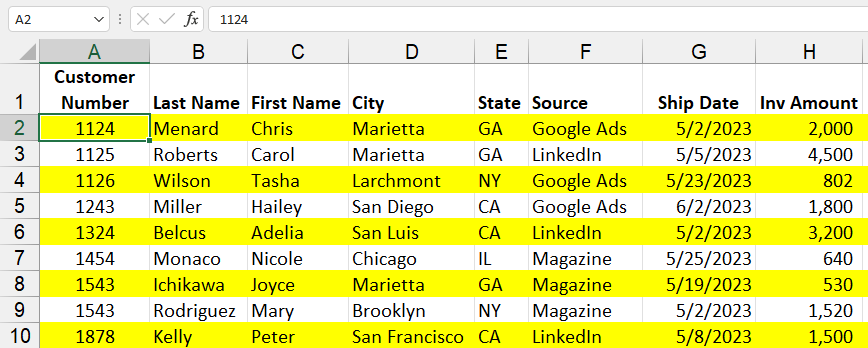
Highlighting or shading every other row in Excel is a great way to make your data easier to read. I'll show three methods for applying color to alternate rows.

**Share every other row in Excel**
Method 1 is my least favorite, but I see users doing this a lot. Method 2 is one of my favorite features in Excel, but for the most control, use method 3. Method 3 is Conditional Formatting and I use the MOD Function and the ROW function. The MOD function returns the remainder of one number divided by another. The ROW function tells you what row you are in.
YouTube Video
Excel - 3 Methods to Shade Every Other Row
Chapters:
- 00:00 Introduction - 00:22 Method 1 - 00:47 Method 2 - 01:27 Method 3 - 05:27 Closing
Method 1 - Manually select every other row
This is my least favorite method. Use the CTRL key to select every other row. It is time comsuming and if you want your data, it will be incorrect.
Method 2 - Create a Table
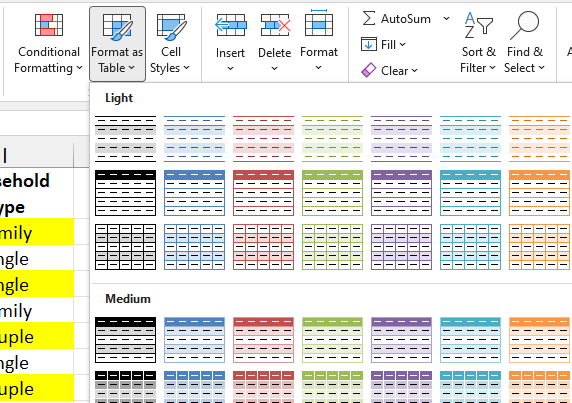
Convert your range to a Table in Excel. **CTRL + T** is the shortcut key or use the Home Tab, and Styles group and the command **Format as Table**.
Tables are a great feature in Excel.

**Format as Table in Excel - Shade every other row**
Method 3 - Use Conditional Formatting
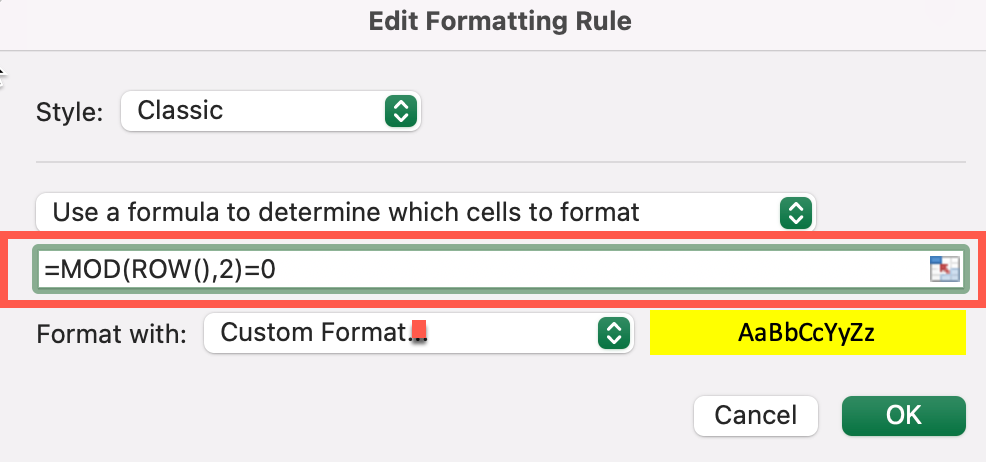
Method 3 is Conditional Formatting and I use the MOD Function and the ROW function. The MOD function returns the remainder of one number divided by another. The ROW function tells you what row you are in.
MOD Examples:
- =MOD(7,2) will return 1. Seven divided by 2 is 3 with 1 remaining. - =MOD(7,3) will return 1. Seven divided by 3 is 2 with 1 remaining. - =MOD(7,4) will return 3. Seven divided by 4 is 1 with 3 remaining. - =MOD(4,2) will return 0. Four divided by 2 is 2 with 0 remaining.
ROW Examples:
- =ROW(A7) will return 7 - =ROW(D6) will return 6. - =ROW() will return 3, if you are in row 3 will return 3.

**MOD and ROW functions in Conditional Formatting**


