Excel Chart Maps used with the Geography Data Type

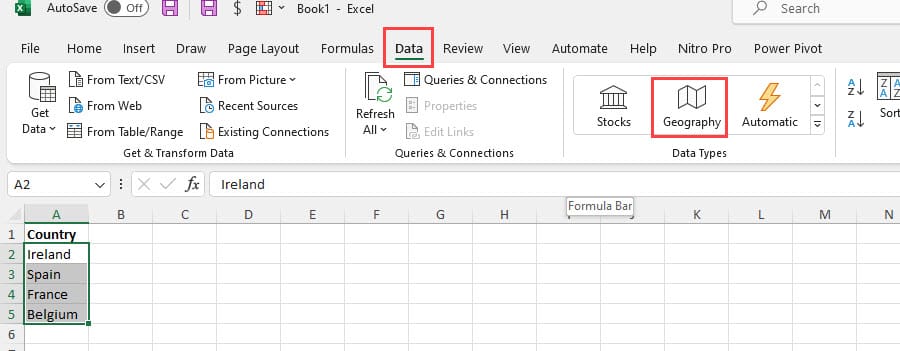
Combine the Geography Data type with a Chart Map. The Geography Data type is located on the Data tab, and Chart Map is on the Insert tab with the other chart types.

Geography Data Type in Excel
You can use the Geography data type with countries, states, and cities. There are 45 fields available, including unemployment rate, population, birth rate, area, GDP, time zone(s), and largest city.
How to use the Geography data type in Excel
1. Type a range of Countries, States, or Cities. 2. Select the range and convert it to a table using **CTRL + T** or click the Insert tab, and then click **Table.** This step isn't required but is recommended. 3. Select the range but not the header row. 4. Click the **Data** tab. 5. Click **Geography** in the data type group. 6. Use the Insert data icon to add fields to the worksheet.

Geography Data Type in Excel - Insert icon for fields
YouTube video
Excel Chart Maps used with the Geography Data Type
Video Chapters
- 0:00 Intro - 0:14 Create a Table - 0:40 Geography data type for Countries - 1:22 Chart Map - 2:15 Geography data type for States
Geography Data Types - full list
01. Abbreviation 02. Agricultural land (%) 03. Area 04. Armed forces size 05. Birth rate 06. Calling code 07. Capital/Major City 08. Carbon dioxide emissions CPI 09. CPI Change (%) 10. Currency code 11. Electric power consumption 12. Fertility rate 13. Forested area (%) 14. Fossil fuel energy consumption 15. Gasoline price 16. GDP 17. Gross primary education enrollment (%) 18. Gross tertiary education enrollment (%) 19. Image 20. Infant mortality 21. Largest city 22. Leader(s) 23. Life expectancy 24. Market cap of listed companies 25. Maternal mortality ratio 26. Minimum wage 27. Name 28. National anthem 29. Official language 30. Official name 31. Out of pocket health expenditure (%) 32. Physicians per thousand 33. Population 34. Population: Income share fourth 20% 35. Population: Income share highest 10% 36. Population: Income share highest 20% 37. Population: Income share lowest 10% 38. Population: Income share lowest 20% 39. Population: Income share second 20% 40. Subdivisions 41. Tax revenue (%) 42. Time zone(s) 43. Total tax rate 44. Unemployment rate 45. Urban population
How to insert a chart map in Excel
1. Click the Insert tab 2. Click Maps and then click Chart map

Insert a Chart Map in Excel

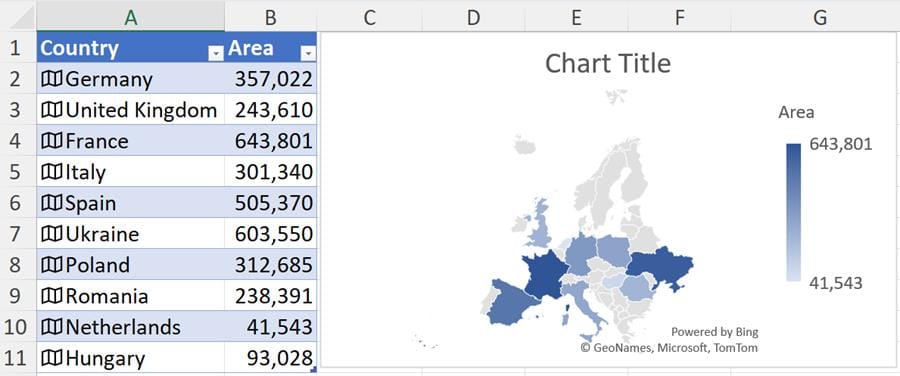
Map Chart in Excel of Countries

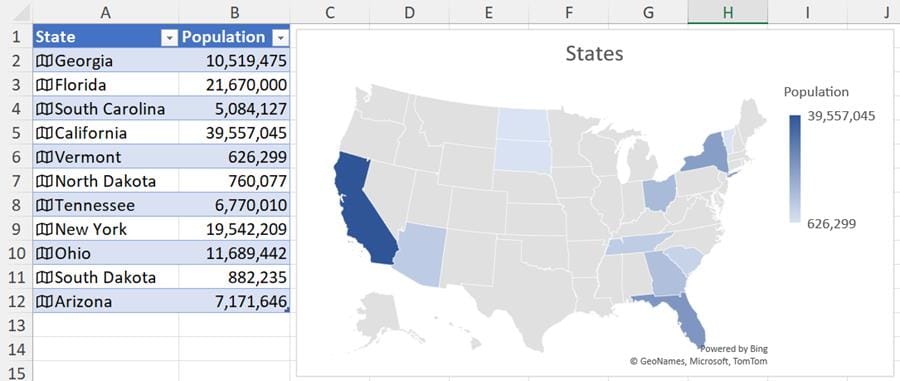
Map Chart in Excel of States


