Dollar Cost Averaging vs. Lump Sum Investing: A Side-by-Side Excel Comparison


Two people can put the exact same amount of money into the market and still end up with different numbers of shares — and different returns when they sell. That comes down to how the money goes in.
The two methods are lump sum investing and dollar cost averaging, and I want to walk through both, then compare them side by side in Microsoft Excel so you can see exactly where each one wins.

What is lump sum investing?
Lump sum investing is the simple one. You get a chunk of money — maybe a bonus check, maybe an inheritance from someone passing away and leaving you money — and you invest all of it into the market at one time. One deposit, one purchase, done.

What is dollar cost averaging?
Dollar cost averaging (DCA) is what most people are already doing, often without thinking about it. Instead of one big deposit, you periodically put money into a retirement or investment account — weekly, bi-weekly, semi-monthly, or monthly. The classic example is a paycheck contribution going into a 401(k).
That covers a lot of people. Roughly 55–60% of workers in the US have access to a 401(k), and about 75% have access to some type of retirement account. If you don't have a company plan, you still have options: a traditional IRA, a Roth IRA, and even self-employment IRAs and other accounts you can open yourself. As long as you're putting money in on a recurring schedule, you're dollar cost averaging.
You don't have to pick just one. Plenty of people contribute to a retirement account every paycheck and drop in extra cash as a lump sum whenever they have it. The two approaches work together.
One advantage of dollar cost averaging
The biggest practical advantage of DCA is that it smooths out the volatility of the market. When prices are high, your fixed dollar amount buys fewer shares; when prices are low, the same amount buys more. You're not trying to time the market — you're just consistently buying. For most people that's a lower-stress way to invest.

There's a historical wrinkle worth knowing, though: putting money in sooner has generally produced better long-term gains. Because the market tends to rise over time, money that's invested earlier has more time to grow. That's the case for lump sum investing when you actually have a lump sum to invest. If you want a quick way to estimate how long it takes invested money to grow, the Rule of 72 is a handy mental shortcut.
Comparing both methods in Excel
Numbers make this concrete, so let's build it out. Excel is perfect for this kind of what-if math — the same way you'd use it to project the future value of an investment. I'll keep the figures clean: a $600 total either way.
For the lump sum, I invest $600 all at once at a share price of $5. The formula is just the amount divided by the price:
=600/5 → 120 shares.
For dollar cost averaging, I invest $100 a month for six months. Each month I divide $100 by whatever the share price happens to be that month. Here's the layout:
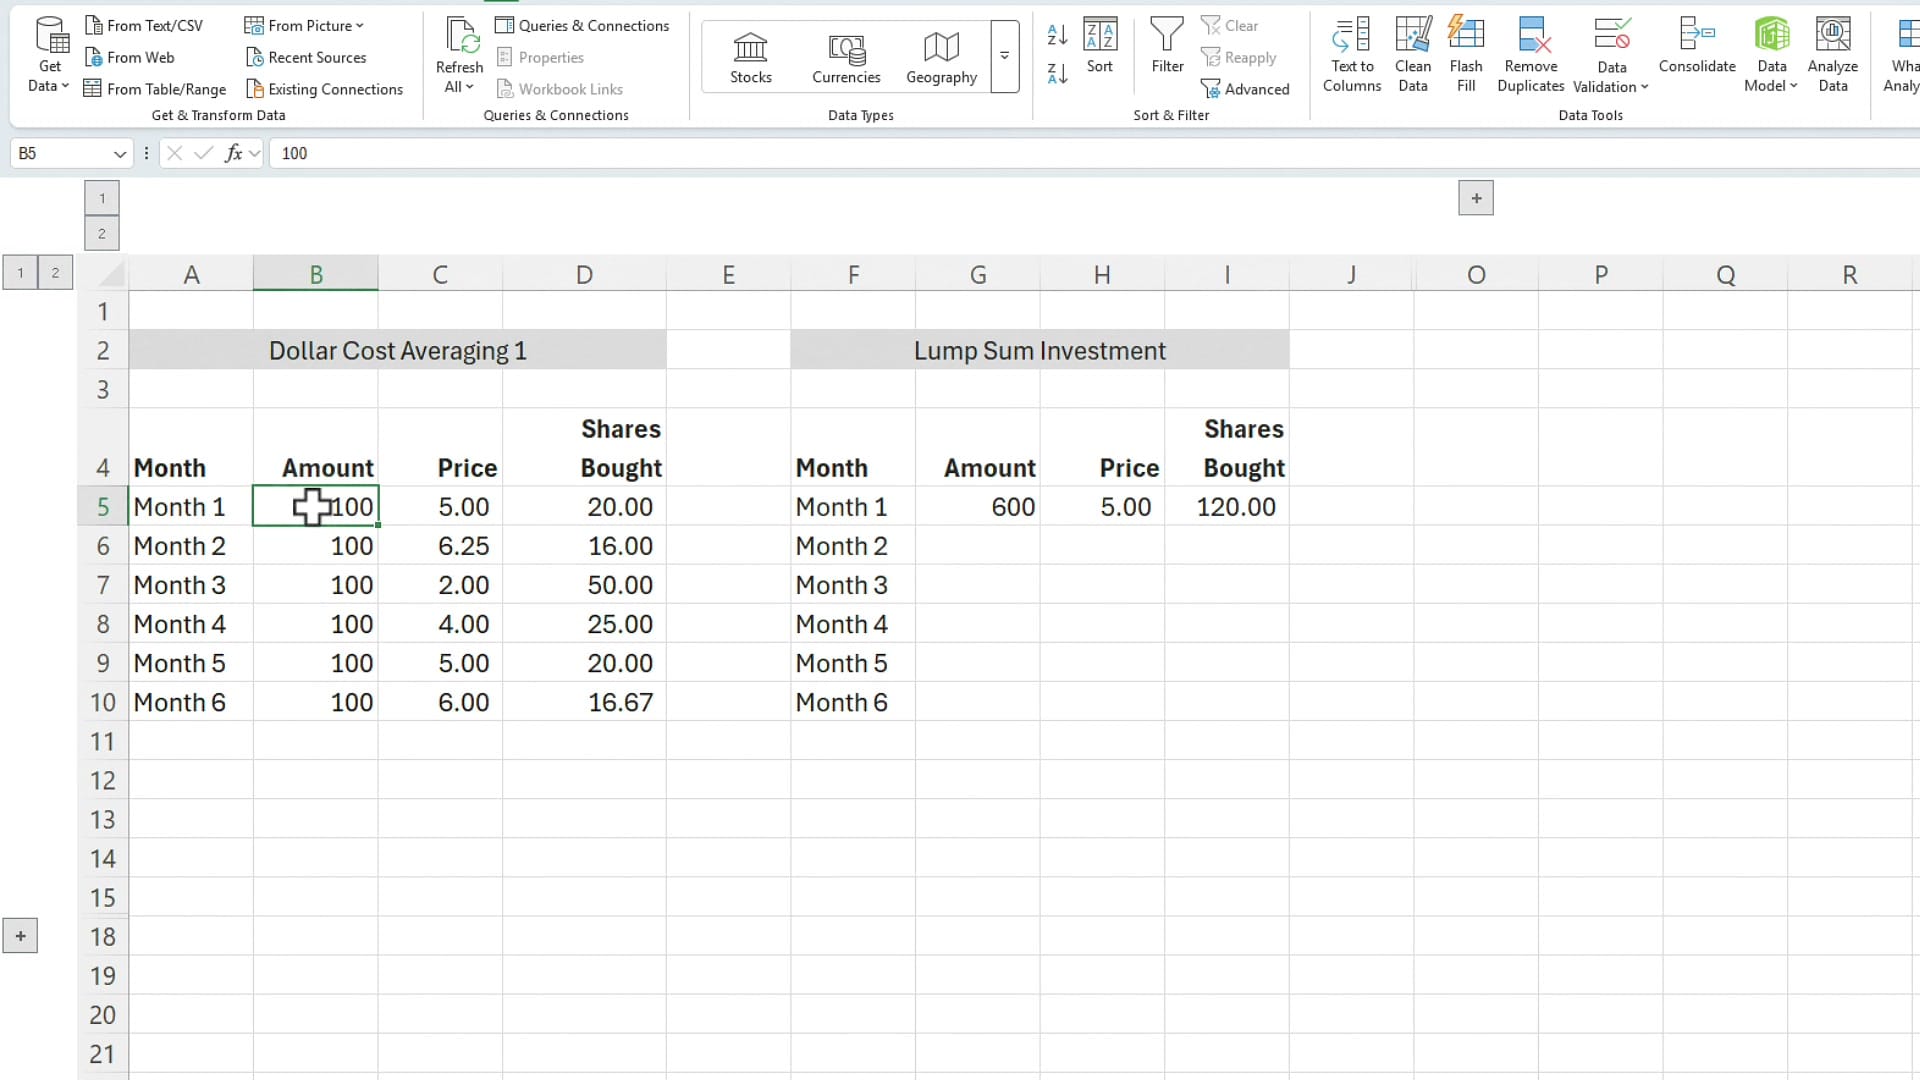
Notice what happens on the DCA side. When the price drops to $2.00, that month's $100 buys 50 shares. When it's $6.25, the same $100 buys only 16 shares. The fixed dollar amount automatically buys more when things are cheap and less when they're expensive.
Total shares and average price
Now total it up. Both columns invested exactly $600. But look at the share counts and the average price paid:
- Dollar cost averaging: 147.67 shares at an average price of $4.06
- Lump sum: 120 shares at $5.00
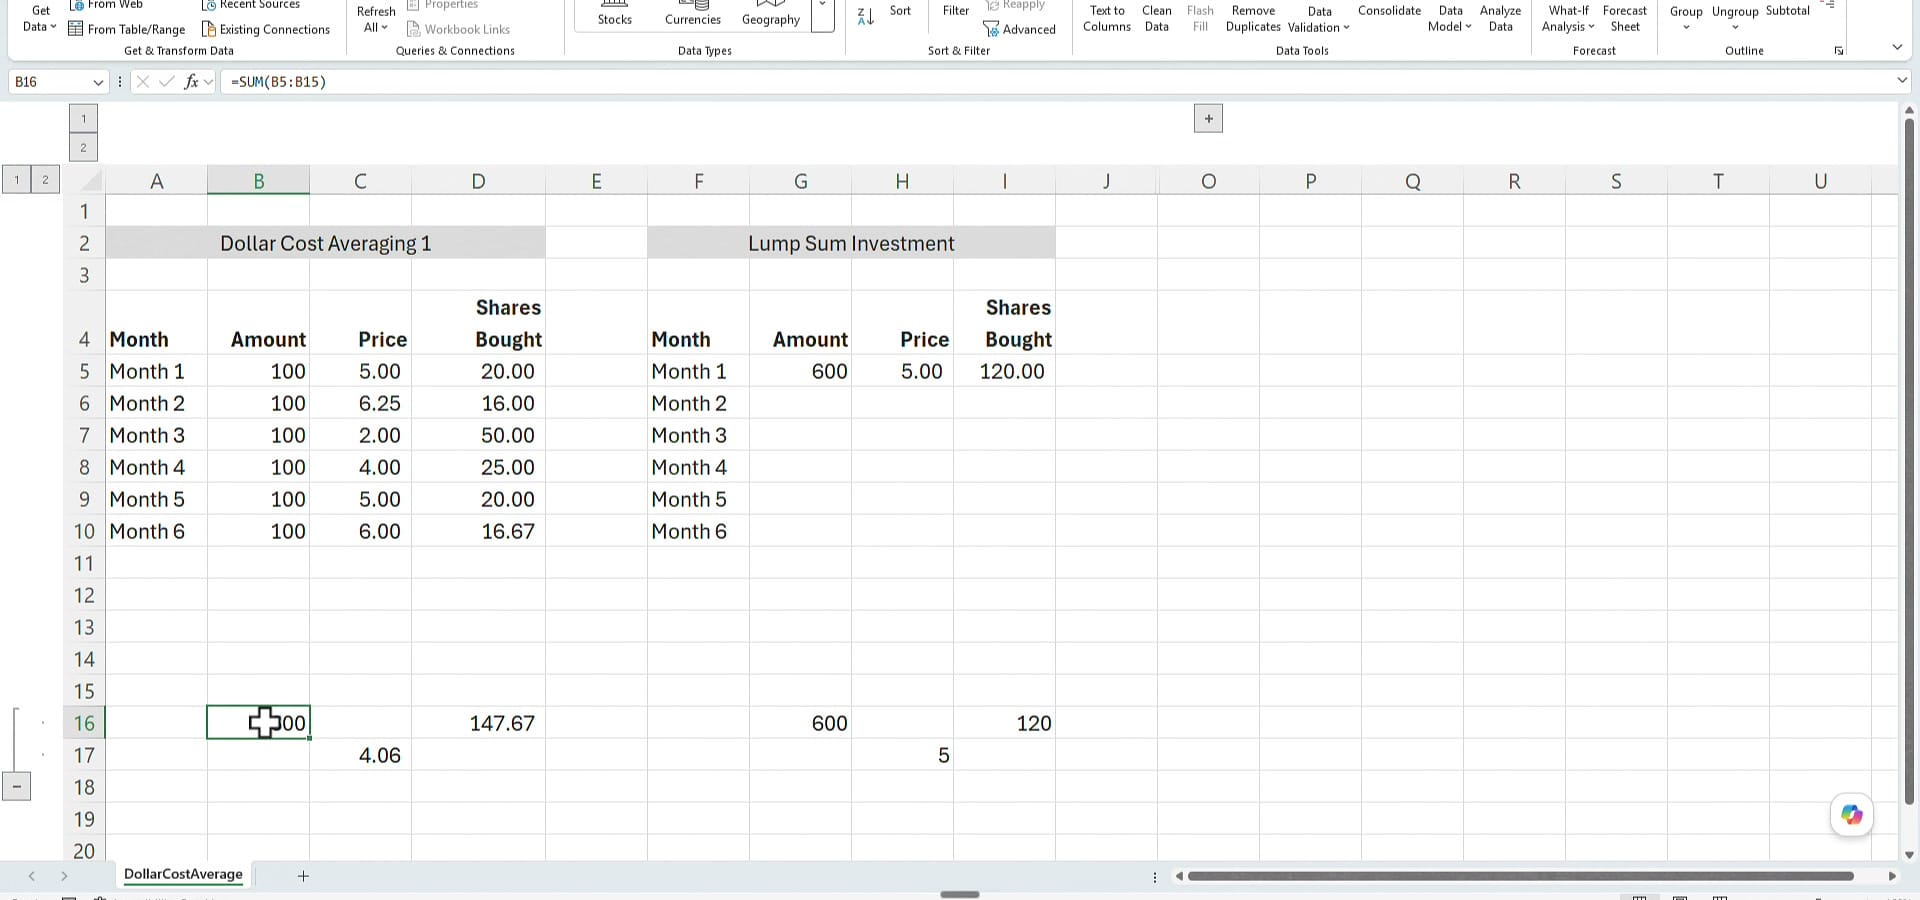
In this example, those low-priced months pulled the DCA average down to $4.06 — well below the lump sum's $5 entry price. More shares at a lower average cost.
Apply a sell price and compare the returns
Average price is interesting, but what matters is what you walk away with. Say you've been invested a long time and you decide to sell, and the price when you get out is $6. Multiply each method's share count by that $6 sell price:
- Dollar cost averaging: 147.67 × $6 = $886.00
- Lump sum: 120 × $6 = $720.00
So in this scenario, dollar cost averaging comes out ahead — $886 versus $720. Before you decide DCA always wins, though, that result depends entirely on the price path. Let me change the prices and run it again.
A second example — where lump sum wins
Same structure, same $600, but this time the monthly prices are different — generally higher, climbing as high as $8 a share with no deep dips. Here's what that does:
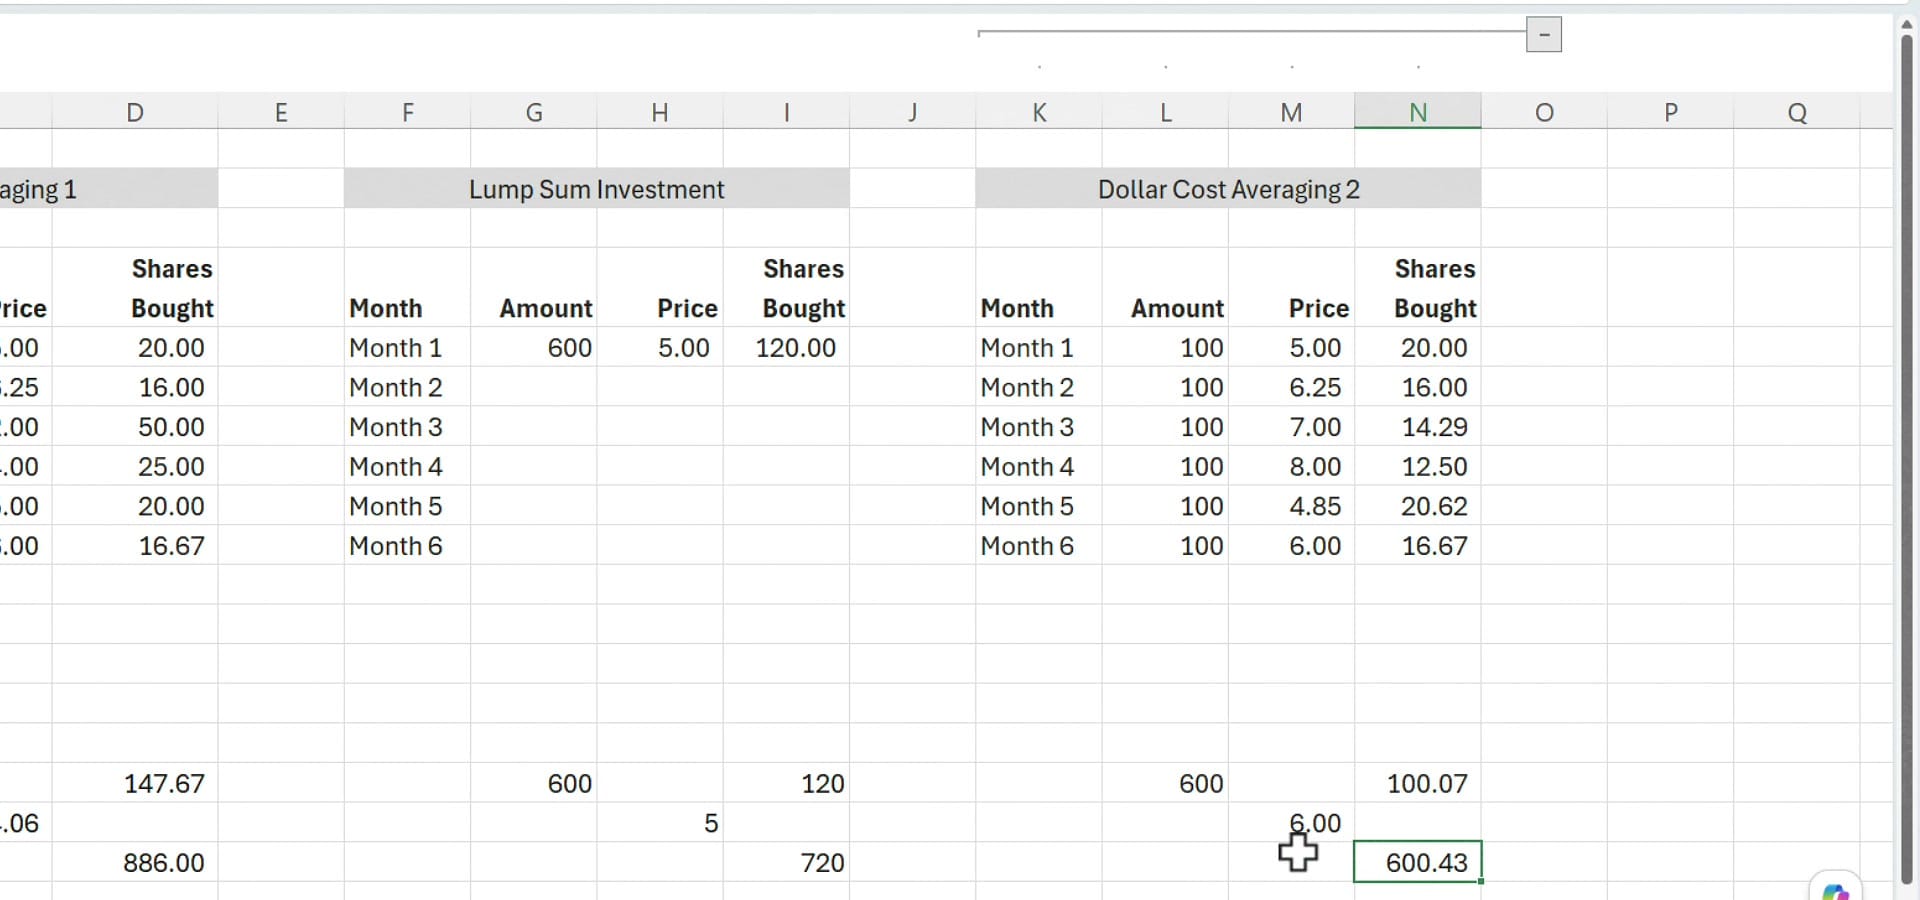
With those higher prices, the monthly $100 deposits only bought 100.07 shares, at an average price of about $6. Sell at $6 and that's worth $600.43 — compared with the lump sum's $720. This time the lump sum wins.
So which one is better?
It depends on what prices do after you invest. Dollar cost averaging shines when prices dip below your starting point, because your fixed deposits scoop up cheap shares. Lump sum shines when prices mostly rise, because all your money was working from day one. Historically, since markets tend to climb over the long haul, getting money in sooner — the lump sum approach — tends to come out ahead.
That said, most people end up dollar cost averaging simply because they don't have a large lump sum sitting around — they invest a piece of each paycheck. Both are sound ways to build wealth, and as we saw, you can do both. If you'd like to dig deeper into modeling these scenarios yourself, take a look at Excel's built-in financial functions.
One disclaimer: I'm not a certified financial planner, and none of this is investment advice. I'm just showing you how dollar cost averaging and lump sum investing actually work, and how to compare them in Excel. If you have questions, leave them in the comments on the video.
Download the file example used in this article:
Related guides