Copilot for Excel - Is it Accurate? 11 Tests Performed
Posted on: 03/28/2024

Introduction to Copilot in Excel
Excel has long been the go-to tool for managing and analyzing data. Now, with the introduction of Copilot in Excel, users have a powerful new assistant to help streamline their workflows. Copilot in Excel is designed to understand natural language queries, making it easier than ever to interact with your data. Whether you're looking to sort data, apply filters, or generate PivotTables, Copilot can assist you every step of the way.
Copilot in Excel - Is Copilot accurate?
Key Features
-
Natural Language Processing: Copilot understands the way you speak, allowing you to perform complex tasks with simple instructions.
-
Efficiency: It automates repetitive tasks, saving you time and reducing the potential for error.
-
Accessibility: Users new to Excel or those not familiar with advanced functions can now perform complex operations with ease.
-
Integration: Copilot seamlessly integrates with Excel, ensuring a smooth user experience without the need to navigate away from your workbook.
In my exploration of Copilot in Excel, I conducted 11 tests to assess its capabilities. Impressively, all 11 tests were successful, showcasing Copilot's ability to accurately interpret and execute a variety of commands. From sorting and filtering to creating PivotTables and answering data-related questions, Copilot proved to be an invaluable tool in navigating Excel's robust features.
YouTube Video - Copilot tested in Excel
Setting Up Your Excel File for Copilot
To fully harness the power of Copilot in Excel, you need to set up your Excel file correctly. This ensures that Copilot can efficiently understand and work with your data. Here's how to get started:
Organize Your Data
First, ensure your data is well-organized. Copilot works best with data that is structured and easy to navigate.
- Use tables: Convert your data range into a table. This helps Copilot recognize your data structure.
- Clean up: Ensure there are no empty rows or columns within your data range.
- Headers: Clearly label your columns with headers. This is crucial for Copilot to understand the nature of your data.
Check Compatibility
Verify that your Excel version is compatible with Copilot. Copilot in Excel requires a Microsoft 365 subscription. Copilot will not be available if you're using a perpetual version of Excel - Excel 2013, 2016, 2019, 2021, or any other version than M365. Consider upgrading to M365 to access Copilot features.
Save Your File
For the best experience with Copilot:
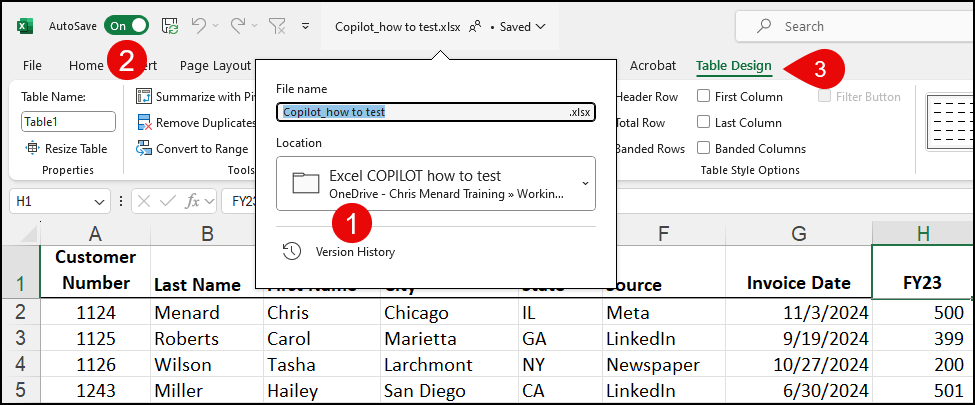
- Save your file to OneDrive or SharePoint. AutoSave must be turned on. AutoSave only works in OneDrive or SharePoint.
- Keep your file accessible. Ensure you're logged into your Microsoft 365 account to use Copilot seamlessly. If you have multiple M365 accounts, make sure you are signed into the correct account.
Following these steps prepares your Excel file for a smooth experience with Copilot. You'll be ready to leverage Copilot's capabilities to analyze data, generate reports, and gain insights more efficiently than ever before.
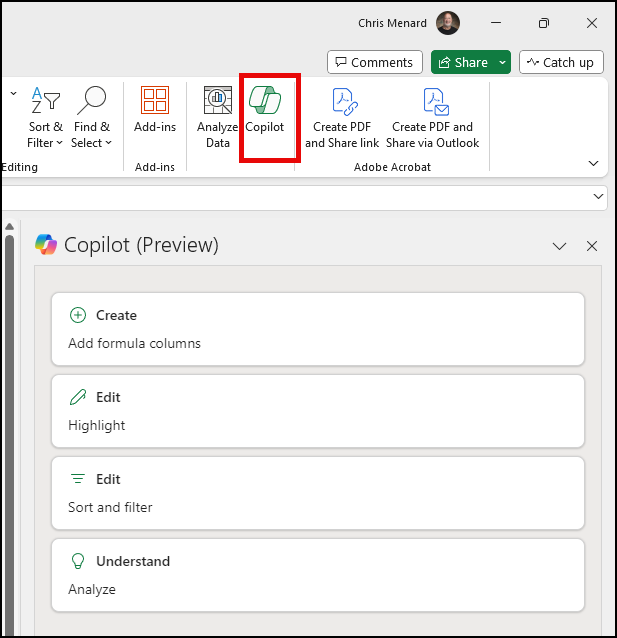
Copilot - 1) OneDrive 2) AutoSave on 3) Table
Test: Sorting Data by Single and Multiple Columns
Sorting data is a fundamental task in Excel, helping users organize their information for better analysis and decision-making. With Copilot in Excel, I wanted to see how it handles sorting by single and multiple columns. This test was crucial for understanding Copilot's ability to manage data efficiently.
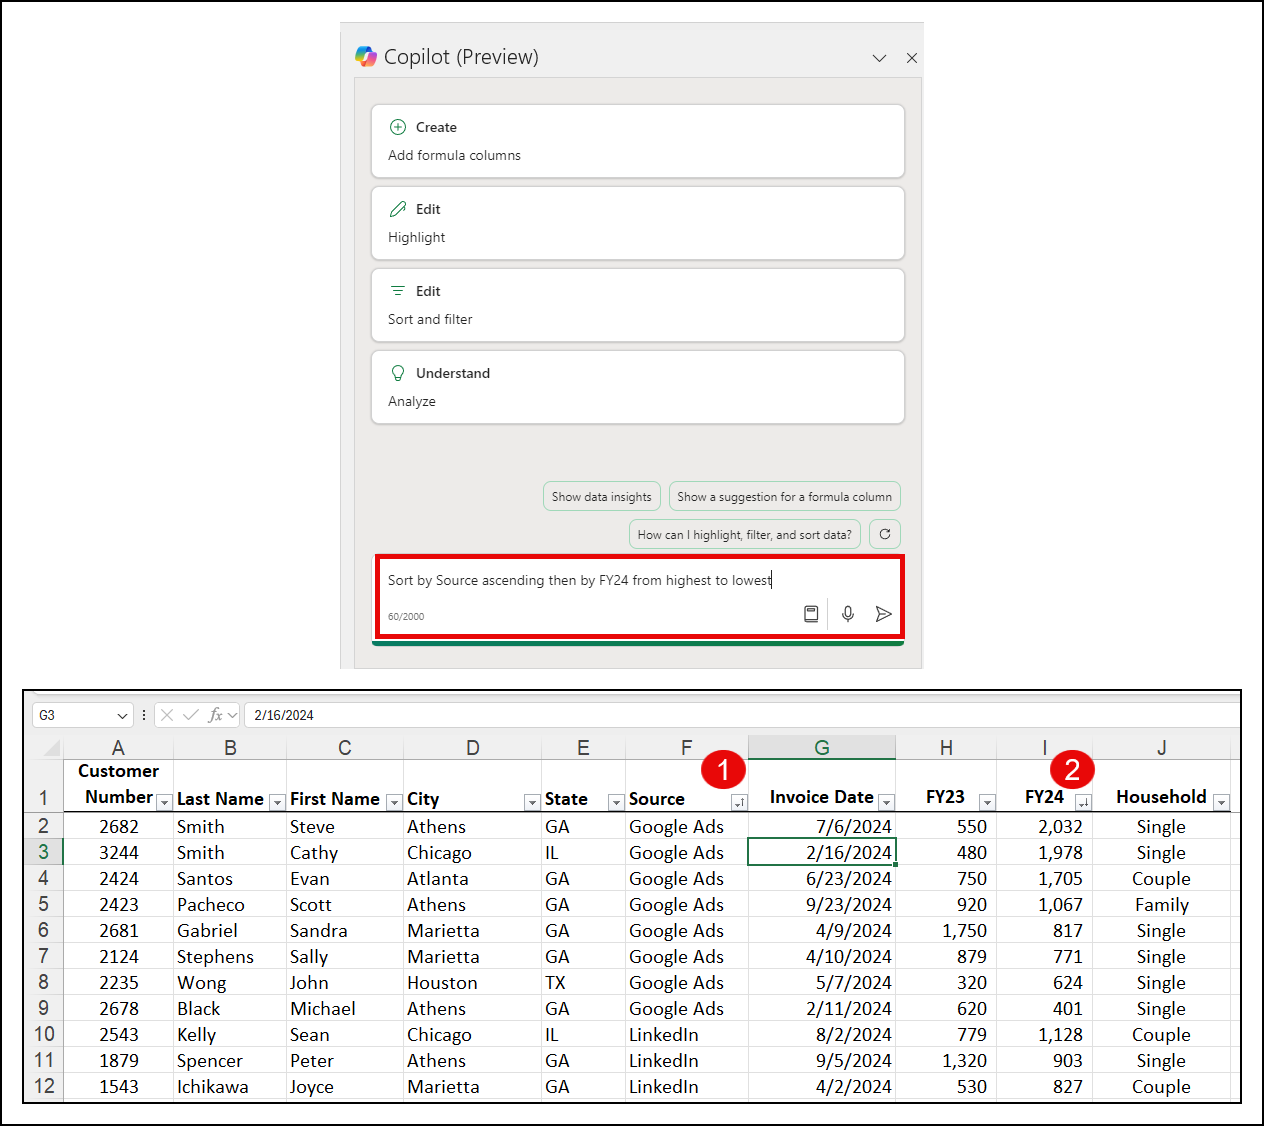
Sorting by a Single Column
My first step was to sort a list of customers by their state in alphabetical order. I instructed Copilot to sort the column, and immediately, it executed the command, displaying the states from A to Z. This quick response proved Copilot's competence in handling basic sorting tasks.
Sorting by Multiple Columns
Next, I increased the complexity by sorting the data first by state and then by city within each state. This time, I watched as Copilot swiftly rearranged the data, accurately placing cities under their respective states in the correct order. It was impressive to see Copilot not just follow through with the command but also maintain the data's integrity, ensuring no mix-ups between columns.
The success of these sorting tests with Copilot in Excel was remarkable. It not only understood my requests but also executed them with precision, showcasing its potential to simplify data management tasks. This functionality is especially useful for users looking to quickly organize their data without delving into manual sorting methods.
Jump to Sorting with Copilot in the video
Copilot Sorting by Text and Numbers
Test: Filtering Data
After mastering data sorting, I moved on to simple filters and advanced filtering techniques with Copilot in Excel. My goal was to refine data visibility, focusing on specific criteria. This test was important to understand Copilot's capability in managing data subsets.
First Test - Filter by one colums
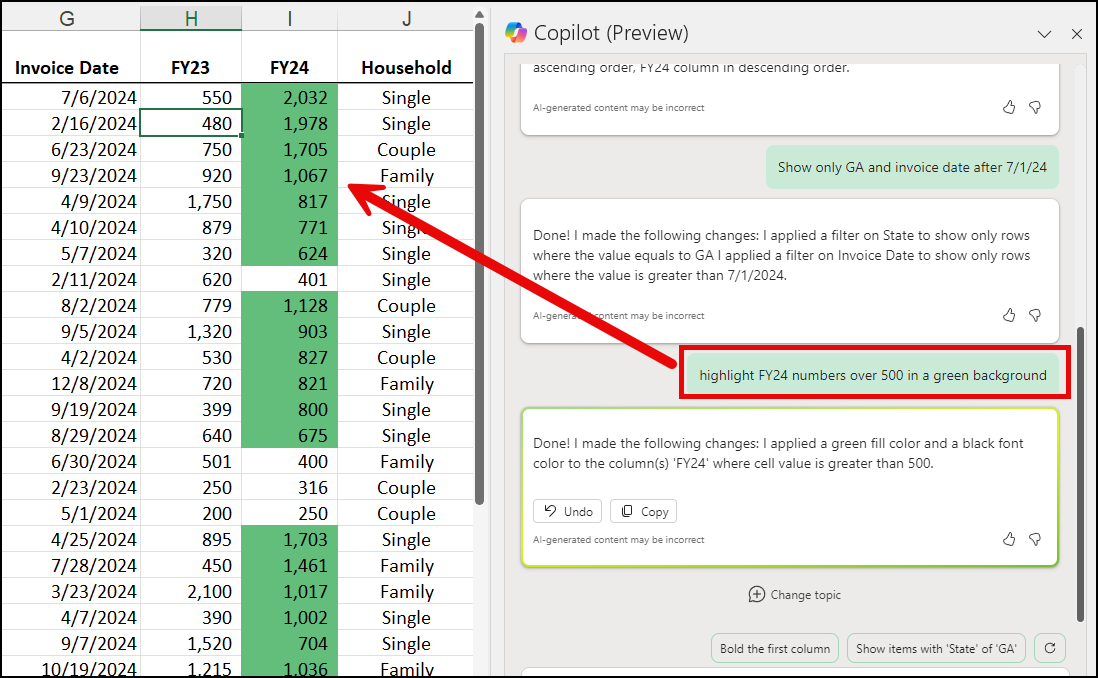
In the first text, I wanted to see if Copilot would filter by the state of Georgia (GA in my data). It worked correctly.
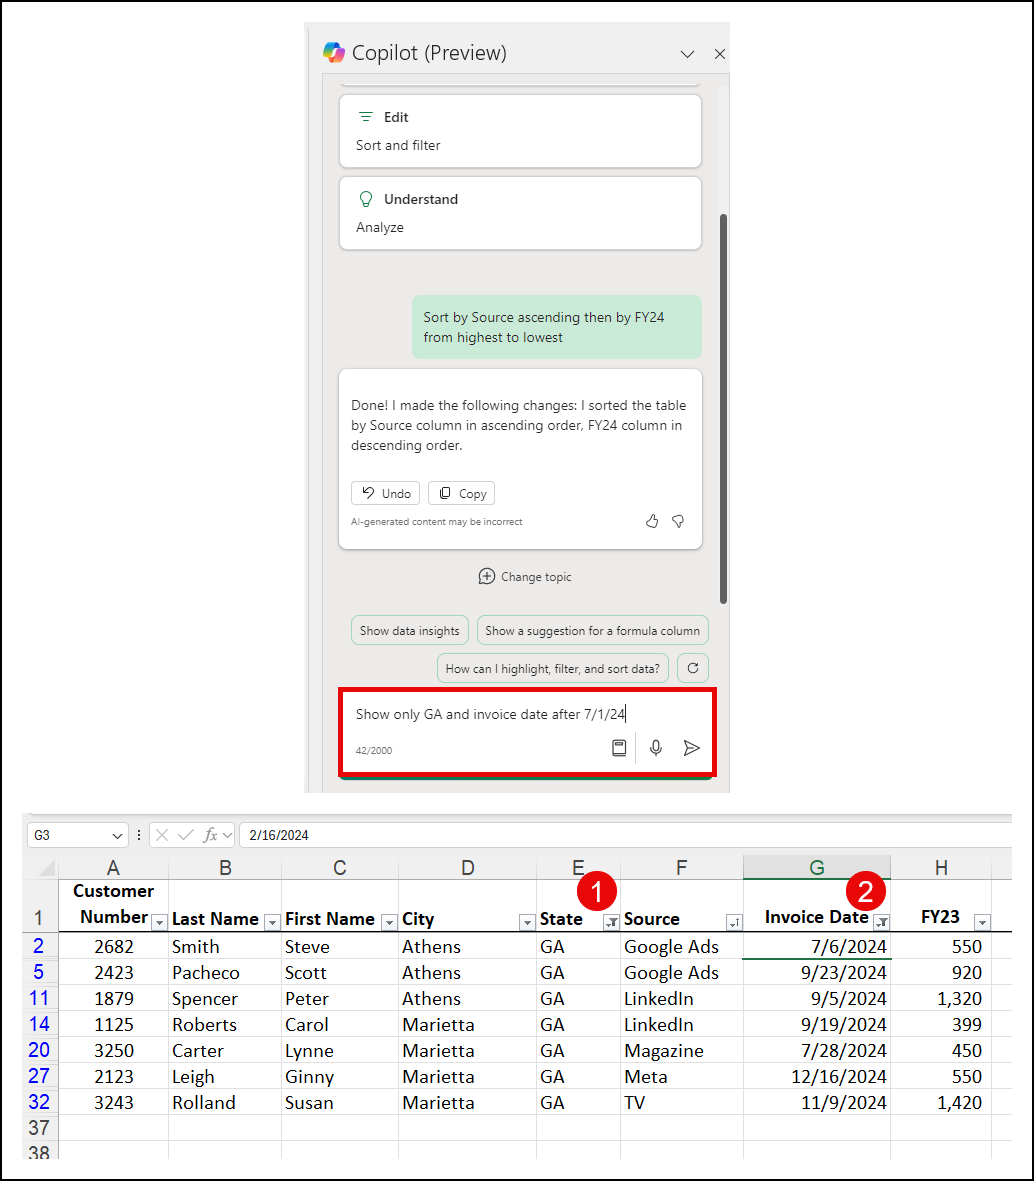
Filter by Multiple Critera 1
I wanted to test filtering by GA and dates after 7/1/24. I wanted to see if two criteria would work using text fieeld and a date filed. Another successful test.
Success with Filtering
The success of these filtering tests with Copilot in Excel was noteworthy. Copilot not only understood my specific requests but also executed them accurately. This functionality is invaluable for users who need to sift through large datasets to find pertinent information swiftly. The time saved and the reduction in complexity when filtering data prove Copilot's worth as an essential tool in data analysis.
Copilot - Filter by multiple columns
Here are some of my courses:
The Copilot course is at an Introductory price. That price will go up soon. We are adding new modules to it every week.
Test: Using Conditional Formatting with Copilot
In my journey to understand the full potential of Copilot in Excel, I tested its capability with conditional formatting. Conditional formatting in Excel allows users to automatically apply formatting changes such as colors, icons, or data bars to cells based on their values. The goal was to see how well Copilot could assist in applying these rules to highlight specific data points.
Defining Conditional Formatting Rules
First, I decided to highlight all sales over $500 in my sales data sheet. I asked Copilot to apply a conditional formatting rule that changes the cell color to green for sales exceeding $500. To my delight, Copilot understood the instruction perfectly and executed the task efficiently.
Applying Conditional Formatting to Date Ranges
Next, I moved on to another scenario where I needed to highlight dates that were within the current month. I was curious to see if Copilot could handle such a dynamic condition. Once again, I instructed Copilot, and it successfully applied the correct conditional formatting. The cells with dates in the current month were highlighted, making them easily distinguishable.
The ability of Copilot in Excel to accurately interpret and execute conditional formatting commands was impressive. It showcased not just its understanding of direct commands but also its ability to handle more nuanced requests involving dynamic data. This test further solidified my confidence in Copilot's capabilities to assist in making data visually interpretable at a glance.
Jump to Conditional Formatting with Copilot in the video
Copilot with Conditional Formatting in Excel
Test: Clearing Formats and Filters with Ease
After exploring complex tasks, I tested Copilot in Excel for its ability to clear formats and filters. This task is essential when preparing data for a new analysis or report. It often seems simple but can become tedious with large datasets.
Clearing Formats Quickly
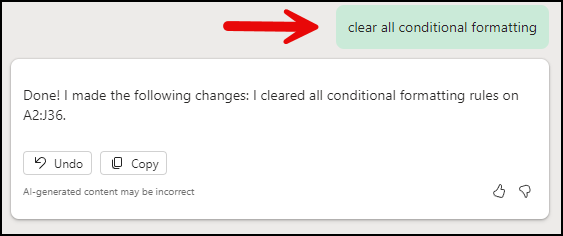
My first task was to remove all conditional formatting from a dataset. These formats had helped me earlier to highlight key data points. However, for my new analysis, I needed a clean slate. I asked Copilot to clear all conditional formatting. To my surprise, it handled the request flawlessly, clearing the formats across the dataset in seconds. This showed Copilot's effectiveness in simplifying data cleanup tasks.
Efficiently Removing Filters
Next, I focused on filters. Filters are vital for navigating large datasets, but they need to be cleared for a comprehensive data review or a fresh analysis. I instructed Copilot to remove all filters from my dataset. It executed the command immediately, providing me with an unfiltered view of my data. This quick adjustment saved me valuable time and showcased Copilot's versatility.
In this test, Copilot in Excel demonstrated its capability to make data management more efficient. Clearing formats and filters with ease allows users to focus more on analysis and less on manual data preparation tasks.
Copilot in Excel - Clear conditional formatting
Test: Leveraging Copilot for Data Analysis Questions
Exploring Copilot in Excel, I ventured into how it handles data analysis questions. This test aimed to assess Copilot's ability to provide insights and answers from the data. My focus was on understanding complex data relationships and extracting meaningful information.
Asking for Data Insights
First, I tasked Copilot with identifying the highest sales month. I simply asked, "Which month had the highest sales?" Copilot quickly analyzed the sales data and provided me with the correct answer. This demonstrated its capability to understand and execute data analysis tasks efficiently.
Complex Data Queries
Next, I raised the complexity by asking for the average sales per region, segmented by product type. This required Copilot to not only sift through multiple data points but also to perform calculations. Impressively, Copilot delivered accurate averages in no time. It was compelling to see it handle such a multifaceted query with ease.
The success of this test highlights Copilot in Excel's prowess in answering data analysis questions. It proves invaluable for users needing quick insights without manually combing through data or performing complex calculations. Copilot stands out as a robust tool for making data-driven decisions more accessible.
Microsoft Teams articles
-
Microsoft Teams - Virtual Appointment - No app required!
Microsoft Teams is rolling out Virtual Appointments. Virtual Appointments make it easy to schedule meetings, and the meeting attendees do not need to install Teams. Even joining from an Android or iPhone, there is no need to install Teams.
-
Teams - How to Add an Excel file or Word Doc to a Teams Channel Tab
Need to quickly access an Excel file or Word document in a Teams Channel? It is easy to add a file as a documents tab in a channel. Before making the document tab, the file must exist in the channel. If you click Files Tab and see the file, you can make it a Tab.
Test: Creating Dynamic PivotTables
For my sixth test, I decided to delve into creating dynamic PivotTables with Copilot in Excel. PivotTables are powerful tools for summarizing, analyzing, exploring, and presenting your data. I wanted to see how Copilot could simplify this process.
Setting Up the PivotTable
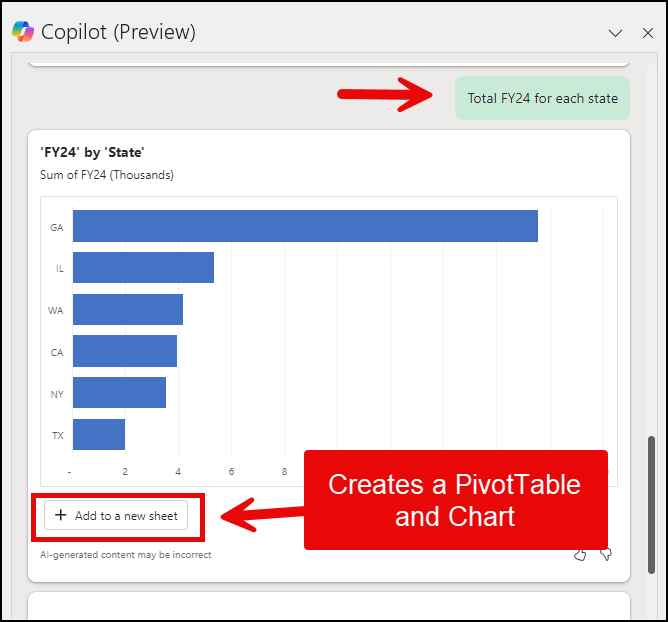
First, I instructed Copilot to create a PivotTable from my sales data. I specified that I wanted to analyze sales by product and region. Copilot quickly generated the PivotTable, placing products as rows and regions as columns. It instantly summarized my data, showcasing the total sales per product in each region.
Adjusting the Data
Next, I wanted to add a layer of complexity by including sales data over several years. I asked Copilot to adjust the PivotTable to compare yearly sales. Copilot responded by adding the years as a new column field, allowing me to easily compare the sales trend over time.
What impressed me the most was how Copilot handled changes to the PivotTable. When I asked to see the average sales instead of total sales, Copilot immediately recalculated the data. This dynamic adjustment saved me a significant amount of time.
Creating dynamic PivotTables with Copilot in Excel proved to be a straightforward process. Copilot's ability to understand complex instructions and generate meaningful summaries of data highlights its potential as a valuable tool for data analysis. This test reaffirmed my confidence in Copilot's capabilities, making data management tasks more accessible and efficient.
Jump to PivotTables and Charts in the video
Copilot in Excel - Create PivotTables and PivotCharts
Test: PivotChart with Rows, Columns, and Values
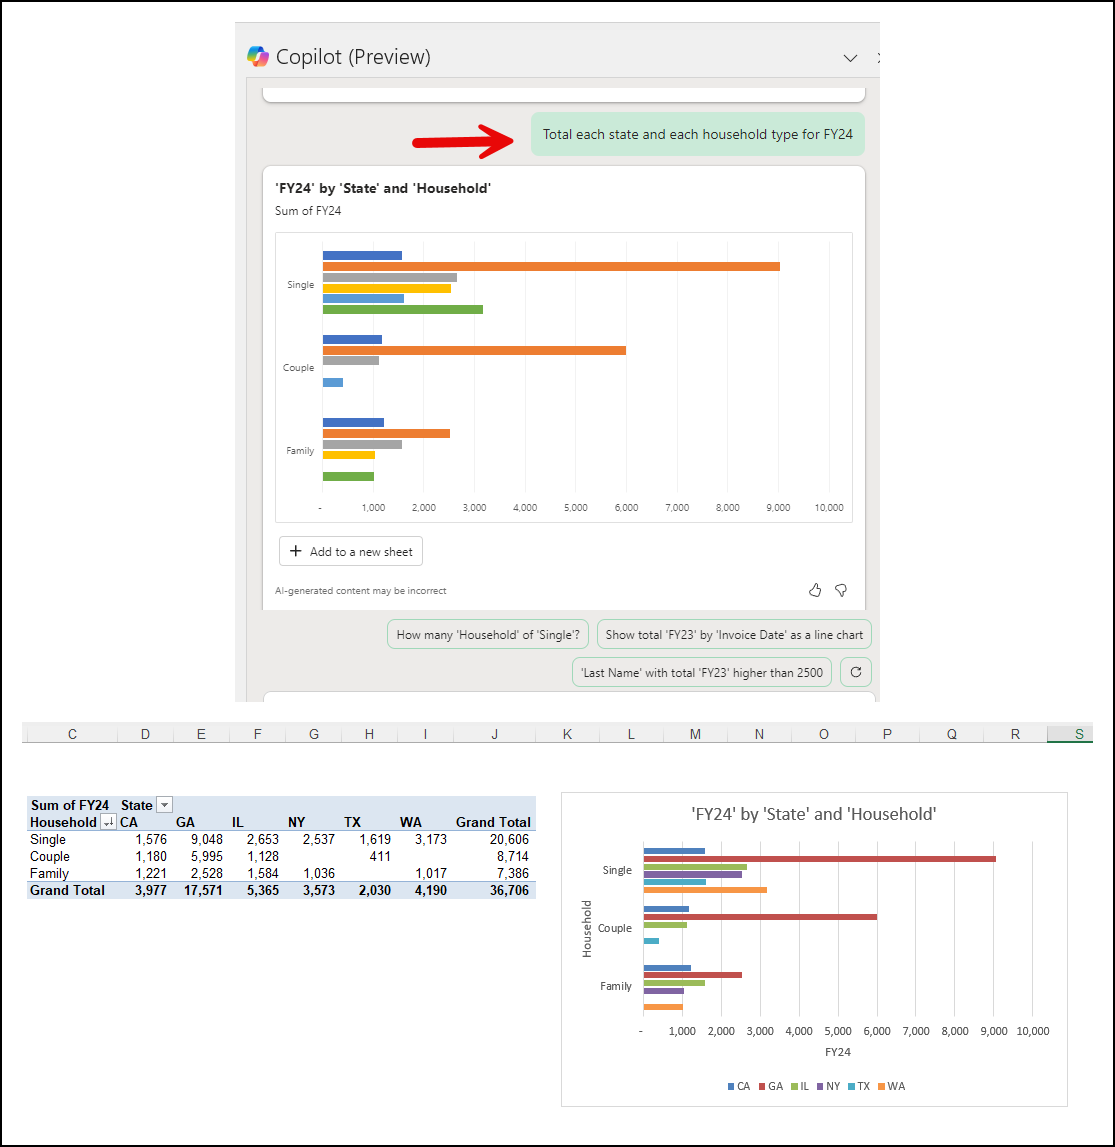
I asked Copilot to Total each state and each household type for FY24
Copilot in Excel - PivotTable with Rows, Columns, and Values
Conclusion: The Future of Copilot in Excel and Final Thoughts
The exploration of Copilot in Excel across various tests has revealed a powerful tool designed to enhance productivity and efficiency in data management and analysis. From sorting and filtering data to creating dynamic PivotTables and visualizing data through complex charts, Copilot has demonstrated its capability to understand and execute a wide range of commands.
Looking Ahead
As we look toward the future, the potential for Copilot in Excel seems boundless. Here are a few key areas of expected growth:
-
Increased Natural Language Understanding: Continuous improvements in natural language processing will make Copilot even more intuitive to use.
-
Expanded Functionality: Future updates may introduce new features, further extending Copilot's range of capabilities.
-
Enhanced Integration: Copilot could see better integration with other tools and platforms, offering a more seamless experience.
In conclusion, my experience with Copilot in Excel has been overwhelmingly positive. All 11 tests were successful, highlighting Copilot's reliability and efficiency. It stands as a testament to how AI can transform our interaction with data, making complex tasks more accessible to a broader audience.
Final thoughts: Copilot in Excel is not just a tool; it's a game-changer in the data analysis and management landscape. Its impact will likely grow, making it an indispensable asset for professionals and casual users alike. As technology evolves, so will Copilot, and I eagerly anticipate its future developments.
Recent Articles

Nov 4, 2025 - Executive Insights: Harnessing Excel for Strategic Analysis
Nov 4, 2025 - Join us on November 4, 2025, for a live, in-person training: Executive Insights – Harnessing Excel for Strategic Analysis. Learn how to master Power Query, PivotTables, data cleaning, sorting and filtering, conditional formatting, and charts to create impactful reports and support leadership with confidence. Perfect for Executive Administrative Professionals looking to boost efficiency and deliver data-driven insights.

Copilot in Word: Quickly Add Numbers with Ease
Discover how Copilot in Microsoft Word can quickly and accurately add numbers within your documents, saving you time and reducing errors. Learn to streamline your workflow with this intelligent assistant.

Chris Menard
Chris Menard is a Microsoft Certified Trainer (MCT) and Microsoft Most Valuable Professional (MVP). Chris works as a Senior Trainer at BakerHostetler - one of the largest law firms in the US. Chris runs a YouTube channel featuring over 900 technology videos that cover various apps, including Excel, Word, PowerPoint, Zoom, Teams, Coilot, and Outlook. To date, the channel has had over 25 million views.
Menard also participates in 2 to 3 public speaking events annually, presenting at the Administrative Professional Conference (APC), the EA Ignite Conference, the University of Georgia, and CPA conferences. You can connect with him on LinkedIn at https://chrismenardtraining.com/linkedin or watch his videos on YouTube at https://chrismenardtraining.com/youtube.
Categories