Understanding Geometric Mean in Excel: GEOMEAN vs. AVERAGE Explained

The geometric mean is a statistical measure that uses multiplication instead of addition to calculate the central tendency of a set of numbers. While most Excel users are familiar with the AVERAGE function, the GEOMEAN function is often the better choice when working with growth rates, investment returns, and other multiplicative data.
Let's look at three practical examples comparing the arithmetic mean (AVERAGE) and the geometric mean (GEOMEAN) in Excel to see when and why the geometric mean gives a more accurate result.
Geometric Mean vs. Arithmetic Mean
The arithmetic mean adds all values and divides by the count. The geometric mean multiplies all values and takes the nth root. For numbers that grow proportionally (like percentages, returns, or population data), the geometric mean provides a more representative average.
Excel's GEOMEAN function syntax is straightforward:
=GEOMEAN(number1, [number2], ...)
Example 1: Basic Calculation with Skewed Data
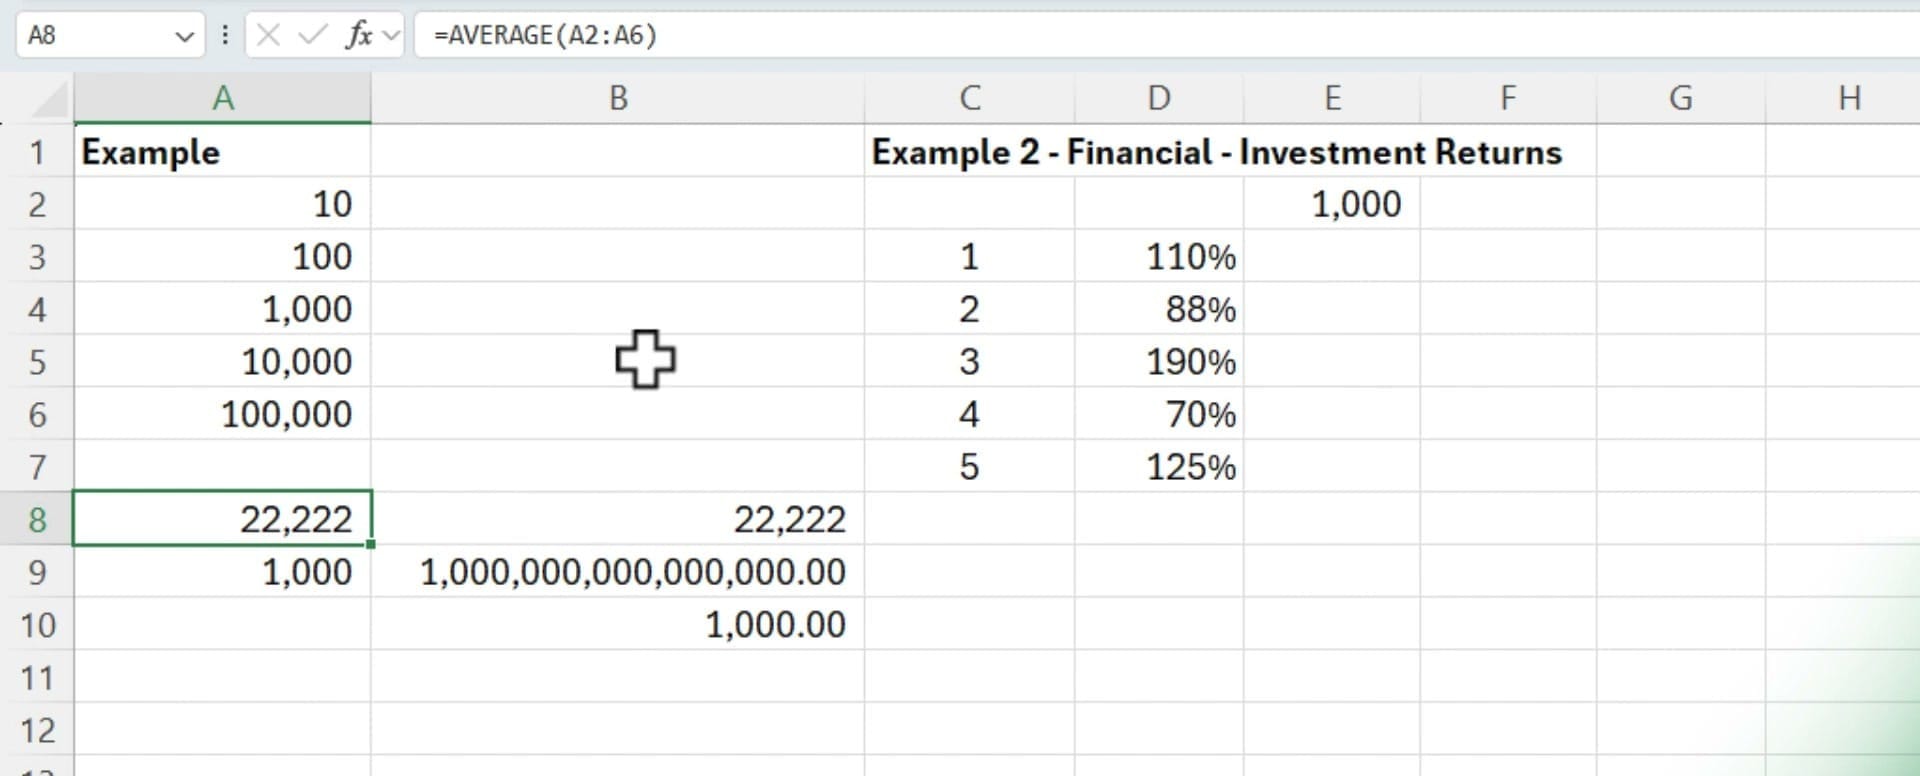
Consider the values 10, 100, 1,000, 10,000, and 100,000. These numbers span several orders of magnitude — a common scenario in real-world data.
Start by calculating the arithmetic mean using the AVERAGE function:
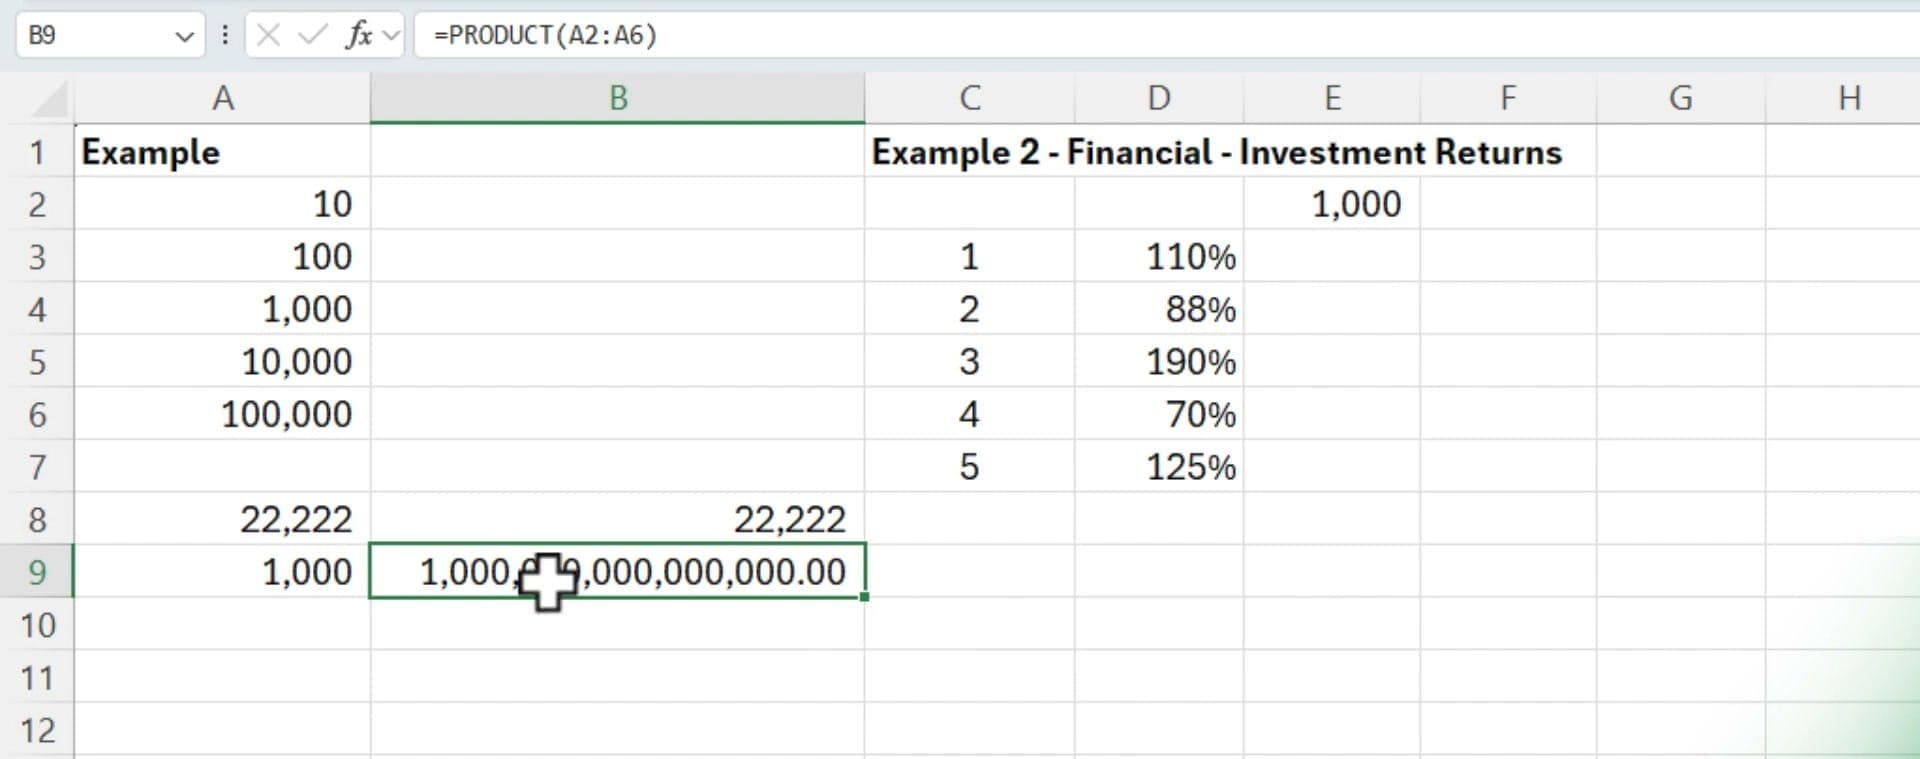
Next, the PRODUCT function shows what happens when you multiply all five values together:
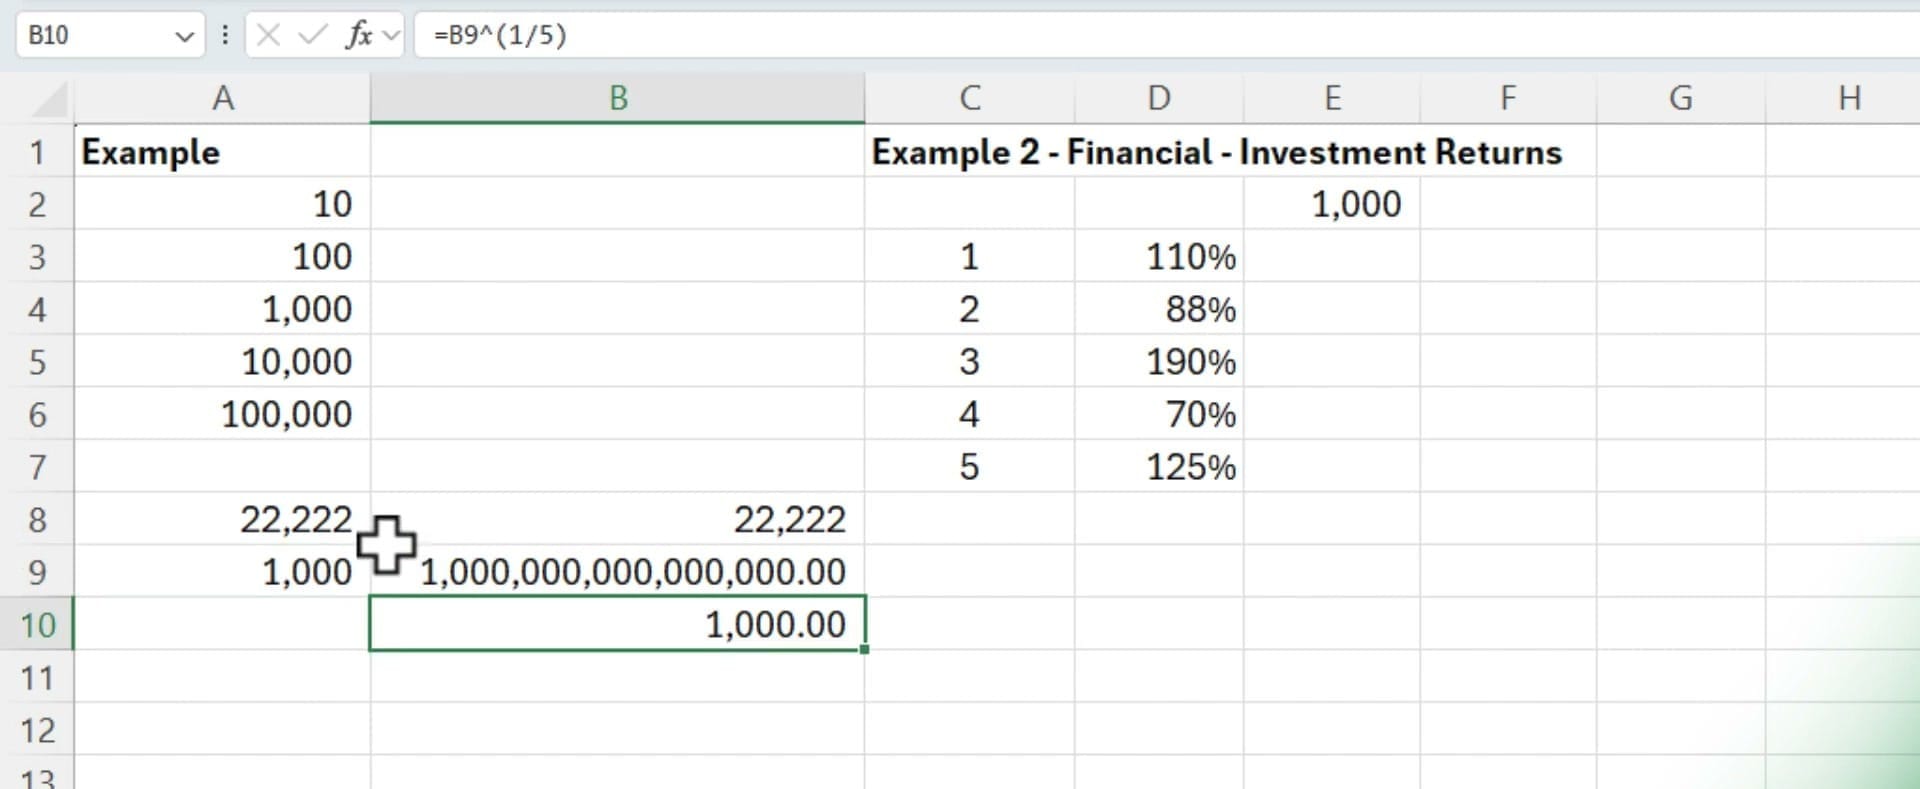
The geometric mean is the nth root of that product. You can verify this manually with the formula =B9^(1/5):
Here's the complete side-by-side comparison for Example 1:
- AVERAGE returns 22,222 — heavily pulled toward the larger values
- PRODUCT returns 1,000,000,000,000,000 (the product of all five numbers)
- GEOMEAN returns 1,000 — the fifth root of that product
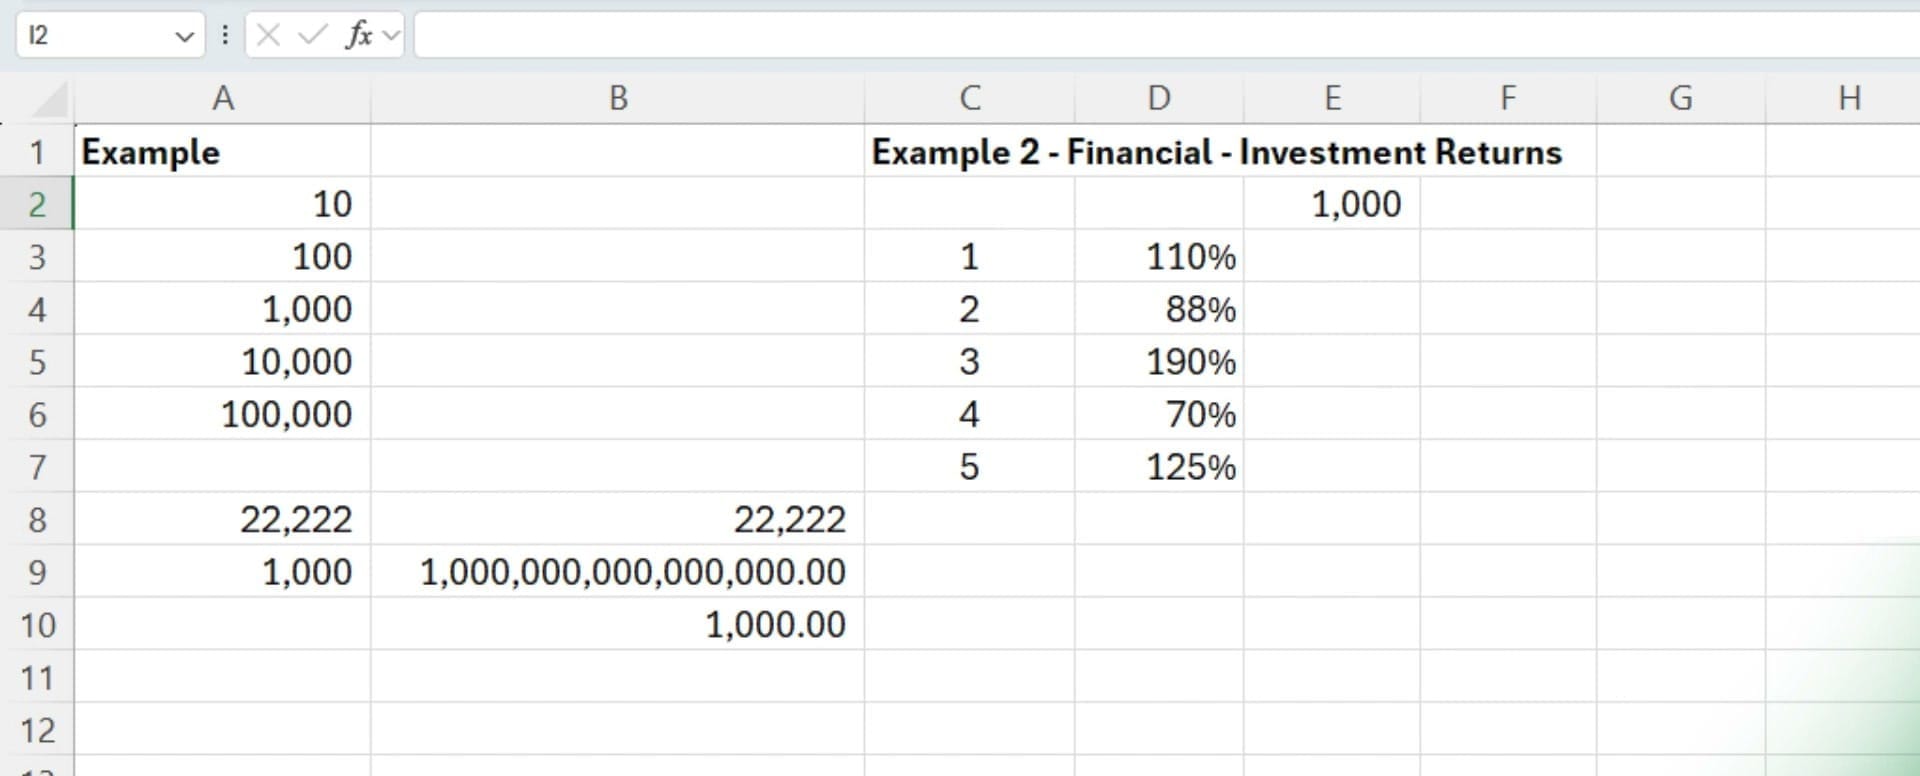
The geometric mean of 1,000 sits right in the middle of the logarithmic scale (10, 100, 1,000, 10,000, 100,000), which makes it a far better measure of central tendency for this type of data than the arithmetic mean of 22,222.
Example 2: Employee Task Duration
For a second example, consider employee task completion times: 7, 6, 150, 98, 6, 15, and 20 minutes. Notice the outliers — 150 and 98 minutes are much higher than the rest.
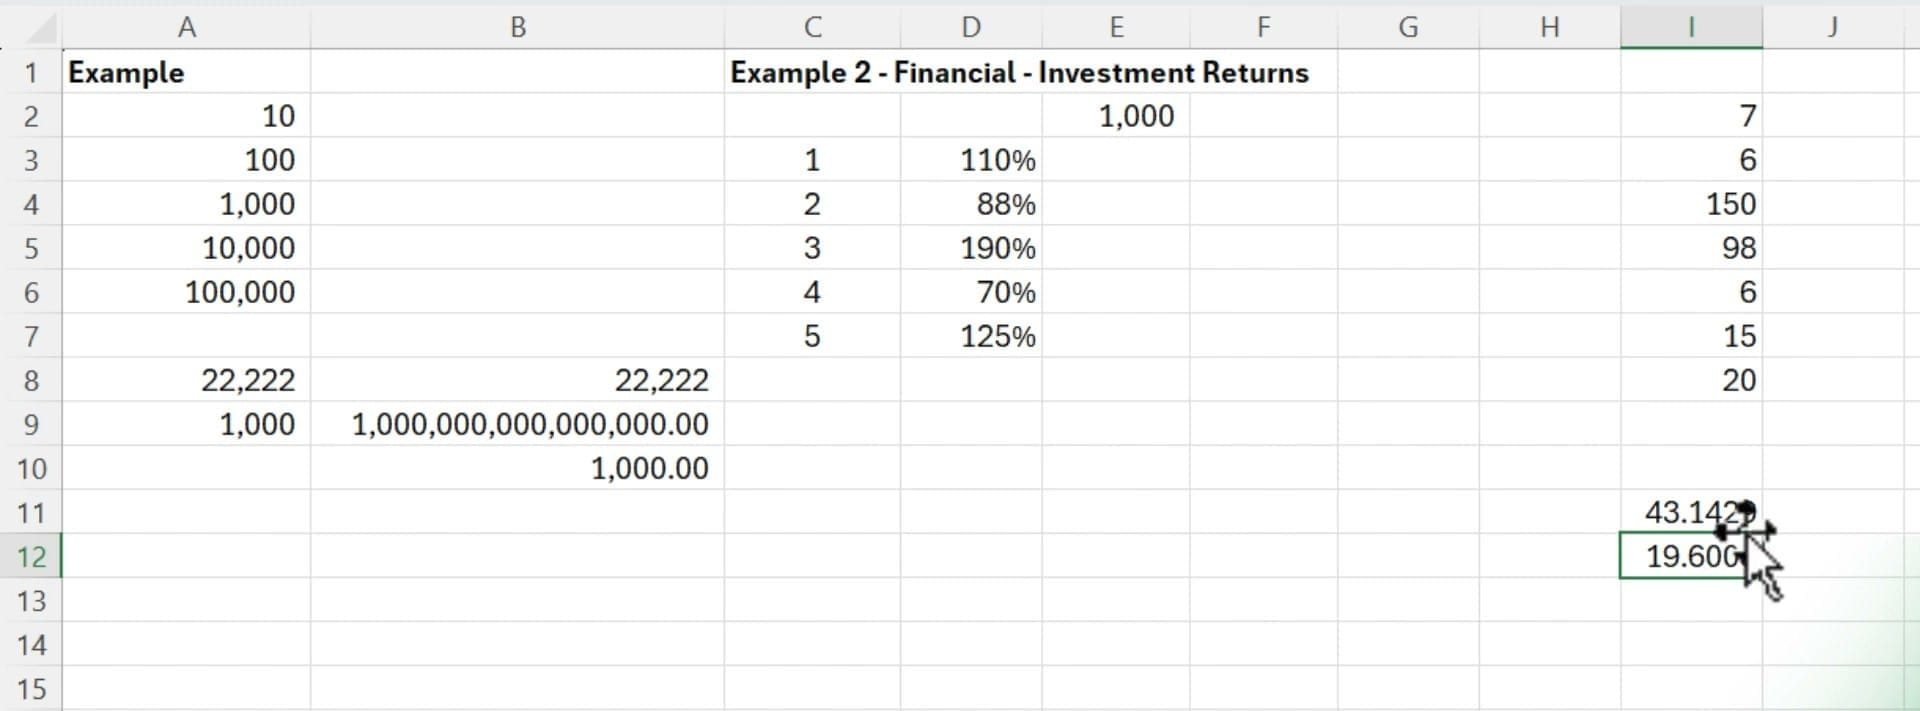
- AVERAGE returns 43.14 minutes — skewed upward by the 150 and 98 outliers
- GEOMEAN returns 19.60 minutes — better represents the typical employee
The geometric mean of 19.60 better represents the typical task duration since most employees finished in under 20 minutes. The arithmetic mean is misleadingly high because of just two outliers.
Example 3: Financial Investment Returns
This is where the geometric mean truly matters. Starting with a $1,000 investment over 5 years with varying annual returns (110%, 88%, 190%, 70%, 125%):
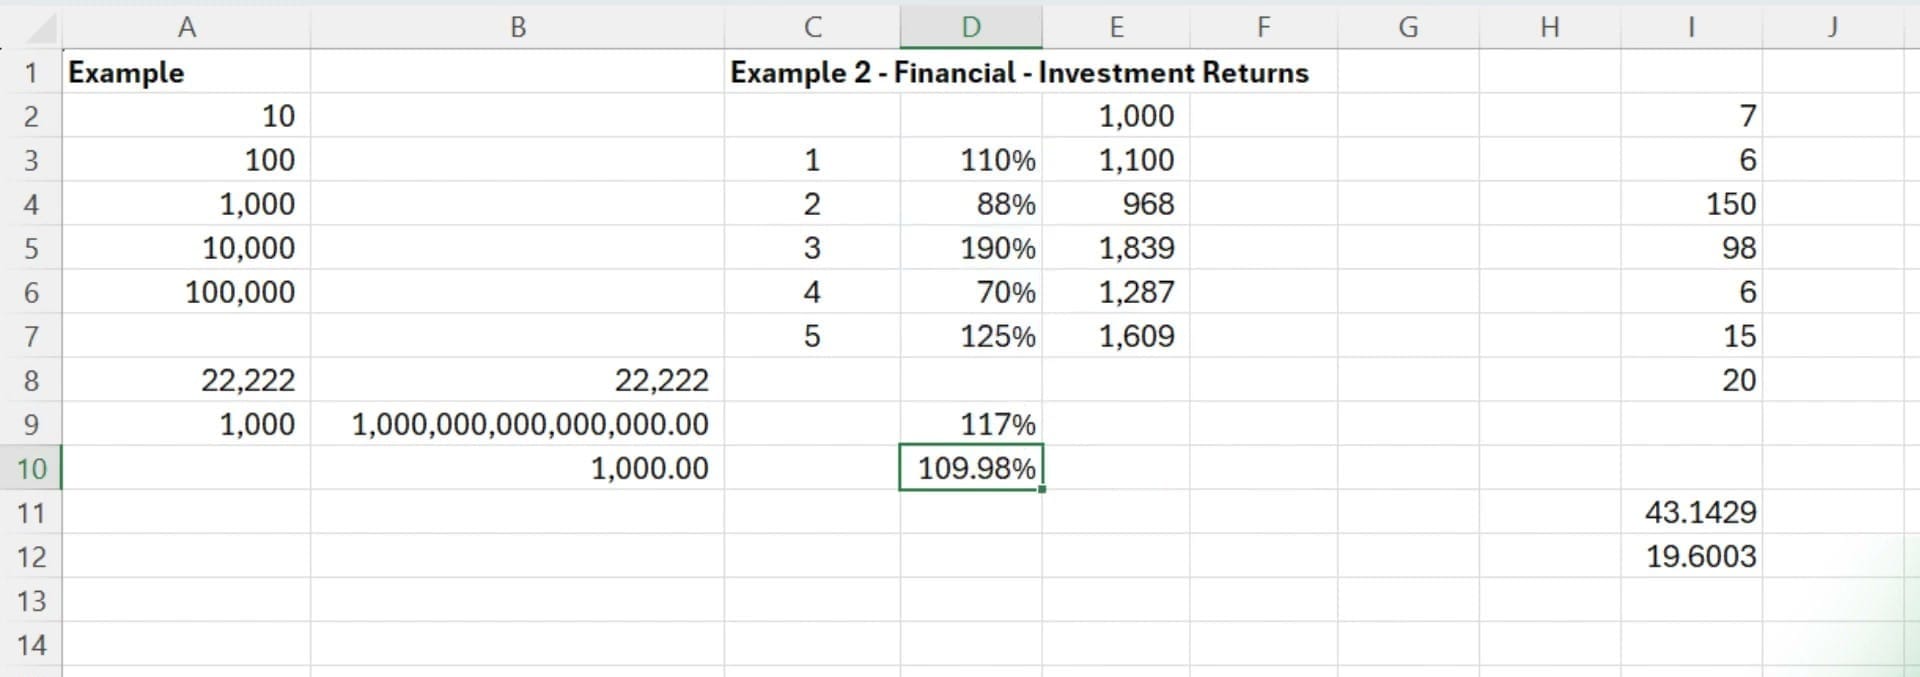
- AVERAGE return: 117% — suggesting the investment grew 17% per year on average
- GEOMEAN return: 109.98% — the actual average annual growth rate
To prove this, calculate the actual investment value year by year in column E. After 5 years, the $1,000 grows to $1,609. Column F compounds the starting $1,000 at the geometric mean rate of 109.98% each year:
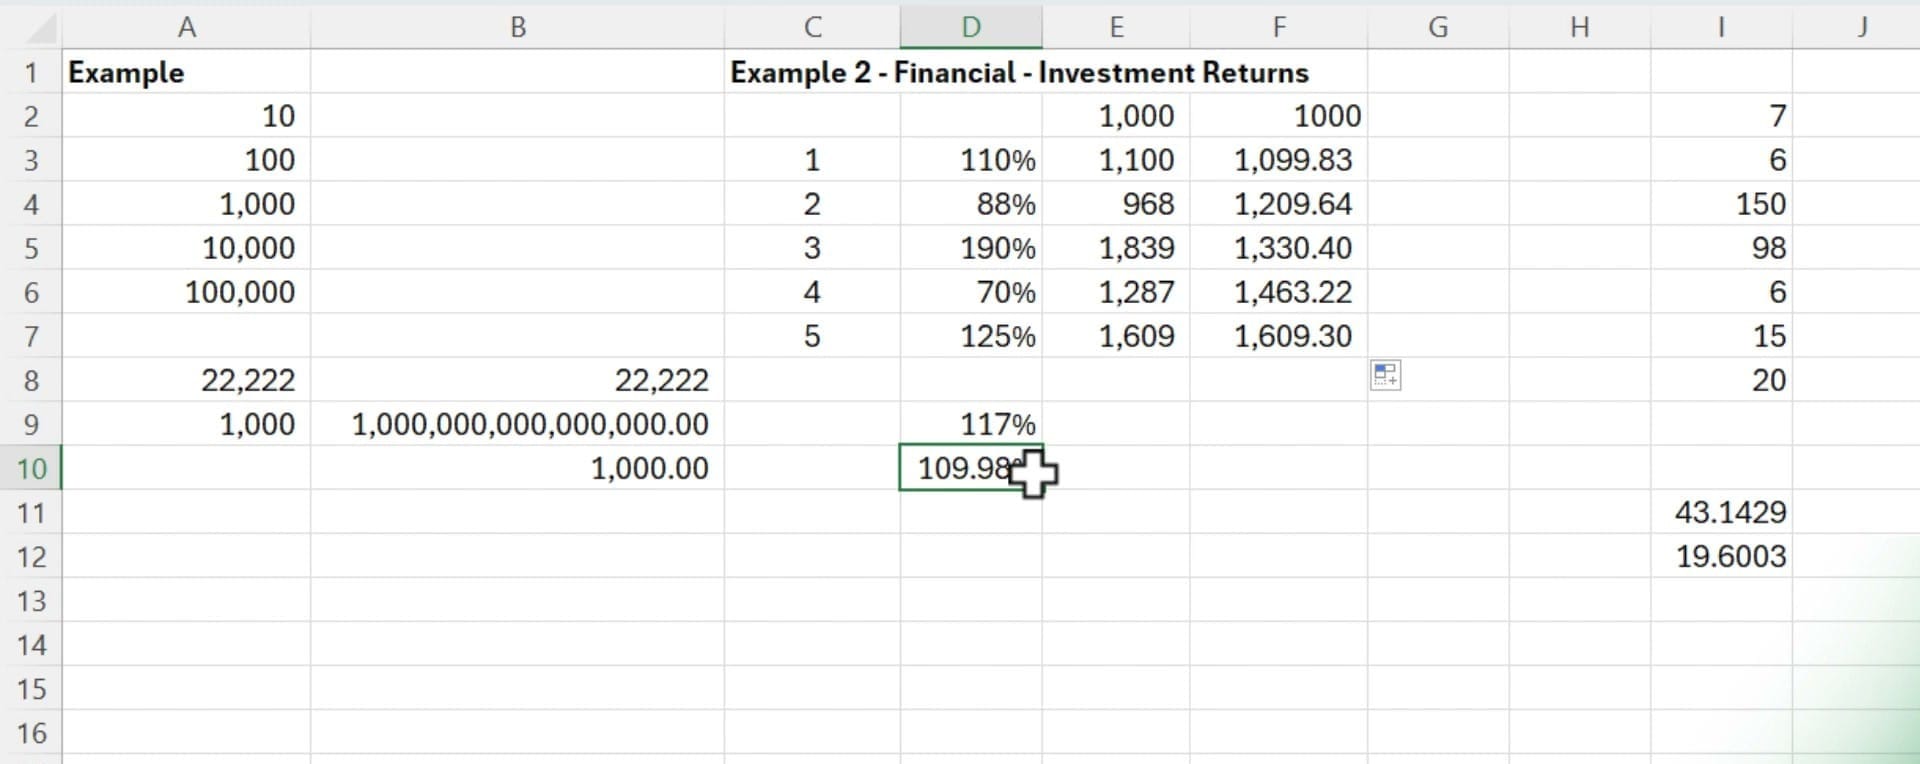
If you compound at the arithmetic average of 17% per year, you'd predict a different (incorrect) ending value. Compounding at the geometric mean of 9.98% per year gives you exactly $1,609.30 — matching the actual result. This is why financial analysts use the geometric mean for calculating financial ratios and average returns. The arithmetic mean overstates compound growth.
When to Use Each Function
- AVERAGE — Use for data that is additive: test scores, temperatures, simple averages where values don't compound
- GEOMEAN — Use for data that is multiplicative: growth rates, investment returns, ratios, indices, data spanning orders of magnitude
A quick rule of thumb: if your data involves percentages, rates of change, or values that multiply together over time, reach for GEOMEAN instead of AVERAGE.
For more on working with financial functions like Future Value in Excel, or to explore statistical functions like COUNTIF, check out the related tutorials.
Want to learn more? Visit courses.chrismenardtraining.com for online training courses.
Related Excel Tutorials