How to Import S&P 500 Data into Excel and Utilize Excel's Stock Data Type
Posted on: 08/15/2024

Introduction to Importing S&P 500 Data
Excel offers powerful features for data analysis, including the ability to pull data from web sources. One common task is importing the list of S&P 500 companies. This guide will demonstrate how to import this data from Wikipedia and utilize Excel's Stock Data Type for further analysis.

S&P 500 - pull data from Web into Excel
Accessing the S&P 500 List on Wikipedia
To begin, we need to access the list of S&P 500 companies on Wikipedia. This list provides comprehensive data on each company, including their headquarters, date founded, and stock symbols.
YouTube Video - Scrape Web Data and use Stock Data Type in Excel
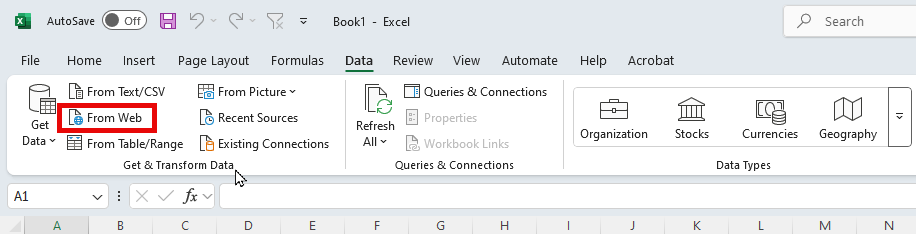
Using Excel's 'From Web' Feature
Excel's 'From Web' feature allows us to import data directly from a webpage. Here’s how to do it:
-
Open a blank worksheet in Excel.
-
Navigate to the Data tab and select 'From Web'.
-
Paste the Wikipedia URL containing the S&P 500 list.
-
Click 'OK' to proceed.
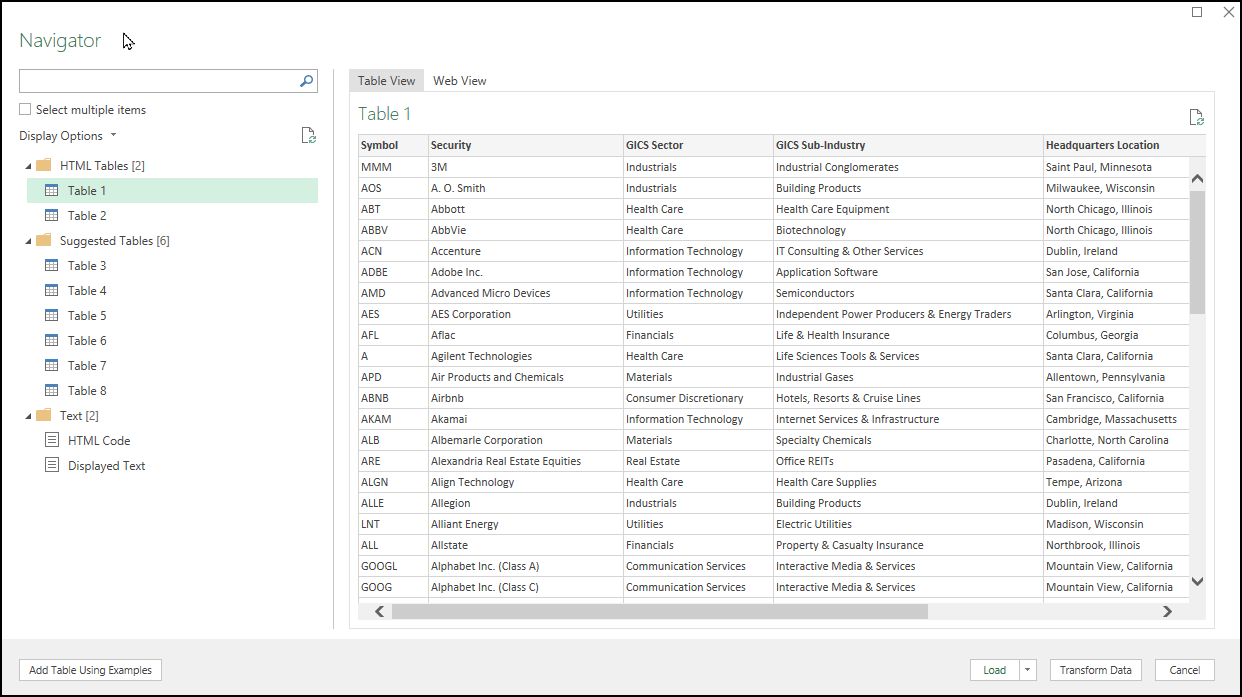
This process will connect Excel to the webpage and identify the tables available for import.
From Web - Data tab in Excel
Navigating Web Page Tables
Once connected, Excel will display the available tables from the webpage. It’s essential to navigate through these to find the correct table containing the S&P 500 data.
Simply click through the tables to preview their contents. In this case, we are interested in 'Table 1'.
Tables from Web - Excel Data from Web
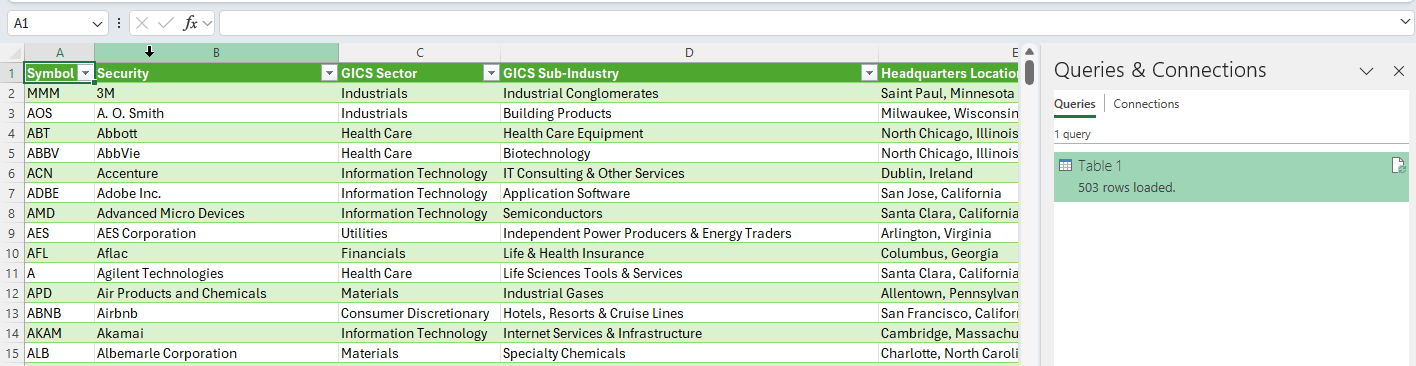
Loading Data into Excel
After selecting the correct table, the next step is to load the data into Excel. If necessary, you can transform the data to ensure it’s in the correct format (e.g., converting text to numbers).
-
Select 'Table 1'.
-
Click 'Load' to import the data into your worksheet.
Excel will then display the data, including 503 rows corresponding to the S&P 500 companies.
Data loaded from the web into Excel
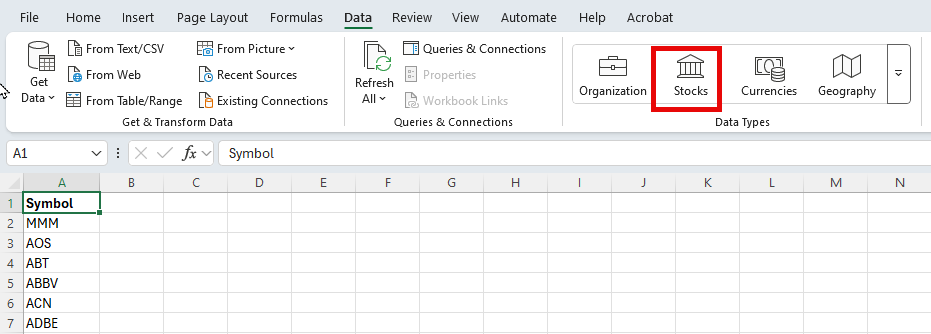
Using Excel's Stock Data Type
With the S&P 500 data imported, we can now utilize Excel's Stock Data Type. This feature allows us to retrieve additional stock information such as prices, previous closes, and 52-week highs/lows.
Follow these steps:
-
Copy the stock symbols from column A.
-
Paste them into a new worksheet.
-
Make the word 'Symbol' bold and convert the data into a table.
-
Select the stock symbols and apply the 'Stocks' data type from the Data tab.
Stock Data Type in Excel
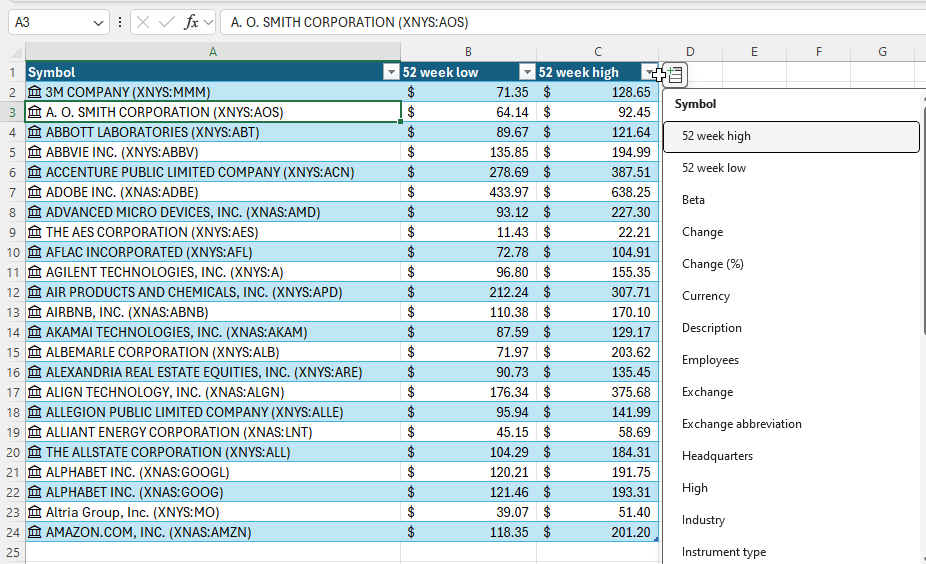
Use the Stock Data Type fields in Excel
Troubleshooting Unrecognized Symbols
Occasionally, Excel may not recognize some stock symbols. In such cases, you need to manually correct these symbols:
Click on the unrecognized symbol, type the correct one, and select it from the suggestions provided by Excel.
Understanding the 503 Companies in the S&P 500
Although the S&P 500 is known for having 500 companies, there are actually 503 due to some companies having multiple classes of stock. For example, Google and Fox each have two listings.
Thee companies with multiple stocks
-
Alphabet - GOOGL and GOOG
-
Fox Corporation - FOX and FOXA
-
News Corp - NWS and NWSA
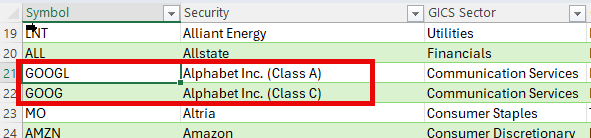
Companies with two stock classes
Conclusion
Importing the S&P 500 data into Excel and utilizing its Stock Data Type opens up numerous possibilities for financial analysis. This guide has shown you how to perform these tasks efficiently. For further learning, consider subscribing to my YouTube channel for more Excel tips and tricks.
Thank you for reading, and happy analyzing!
Recent Articles

Copilot in Word: Quickly Add Numbers with Ease
Discover how Copilot in Microsoft Word can quickly and accurately add numbers within your documents, saving you time and reducing errors. Learn to streamline your workflow with this intelligent assistant.
Categories