Excel Distinct Count with a PivotTable
Posted on: 03/31/2022

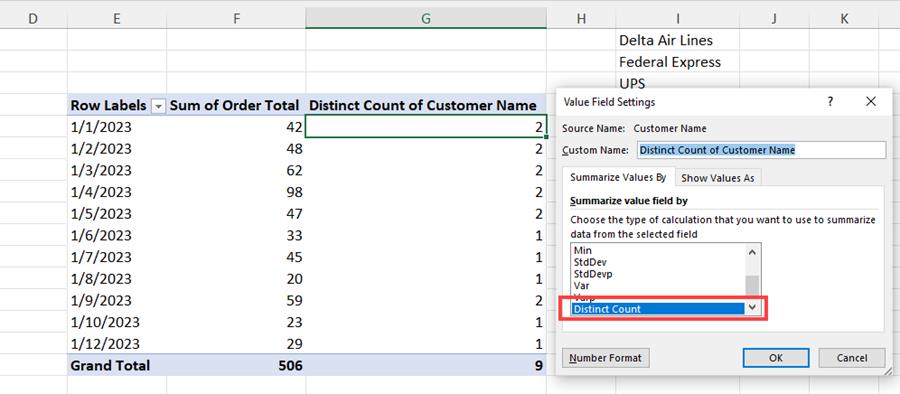
PivotTables in Excel can create a Distinct Count. An example of a distinct count is we had five orders in one day, but three orders were placed by the same customer. I want to know we have five orders from three customers.

PivotTable with a Distinct Count
To create a distinct count in a PivotTable, there is a box you must check to have this feature enabled in your PivotTable. In this short video, I'll demonstrate a PivotTable without a distinct count, create another PivotTable with a distinct count, and finally show the awesome UNIQUE function. The tip is to select Add this data to the data model when creating your PivotTable.
YouTube video
Chapters/Bookmarks
-
0:00 Intro
-
0:15 PivotTable without distinct count
-
2:10 PivotTable with distinct count
-
4:15 UNIQUE Function in Excel
Create a PivotTable with a Distinct Count

Add this data to the Data Model
-
Click inside your data
-
Click the Insert Tab and click PivotTable
-
Make sure to check Add this data to the Data Model (see screenshot above)
-
Click OK
-
Drag your fields to the PivotTable field area
-
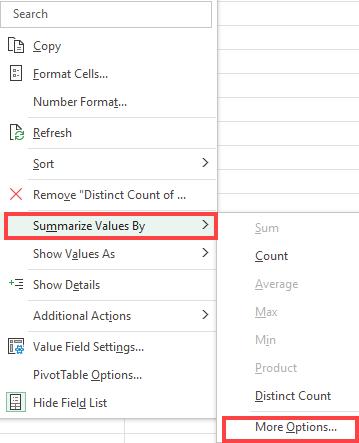
To do a distinct count, right-click and click Summarize Values By and click More Options
-
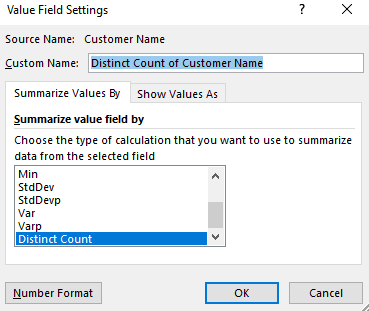
Scroll to the bottom and select Distinct Count

Summarize Values By - More Options

Distinct Count - Value Field Settings
Recent Excel articles

Mastering Excel Slicers: A Comprehensive Guide
Excel slicers are powerful tools that enhance data filtering in Microsoft Excel, making it easier to visualize and analyze your data. In this blog, we will explore how to create and effectively use slicers, as well as their advantages and limitations in comparison to traditional filters.
Categories