Break-even in Accounting - Cost Volume Profit Analysis

The break-even point is when a company has Net Income of zero ($0.00). The revenues generated covered the expenses. There are two types of costs:
- fixed - variable
To find the break-even point, you need to know the **Contribution Margin**. The contribution margin can be shown as either a percentage or per unit number.
Calculate the Break-even point
The breakeven point is equal to the total fixed costs divided by the contribution margin per product. The contribution margin is the difference between the unit price and variable costs.
Variable Cost
Variable costs vary based on the amount of output. If you produce more products - going from 80 units to 90 units - variable costs go up. If you produce fewer products, variable costs go down.
**Examples of variable cost:**
1. Direct material 2. Direct labor 3. Sales commissions 4. Credit card fees 5. Freight out

**Breakeven point in units**
Fixed Expenses
Fixed costs stay the same regardless of the amount of output. Producing more or less does not affect fixed costs.
**Examples of fixed cost:**
1. Supervisors' salaries 2. Rent 3. Insurance 4. Utilities 5. Depreciation
Calculate the break-even based on contribution margin per unit.
Divide the fixed cost by contribution margin per unit to get the number of units to break-even. In the example below, our contribution margin is $25 per unit (52-27), and we have fixed expenses of $15,000. Divide 15,000 by 25 and to get 600 units. Below 600 units is a net loss. Above 600 units is a net profit. Every unit produced over 600 generates $25 in net profit.

**Breakeven in Excel - net income is zero**
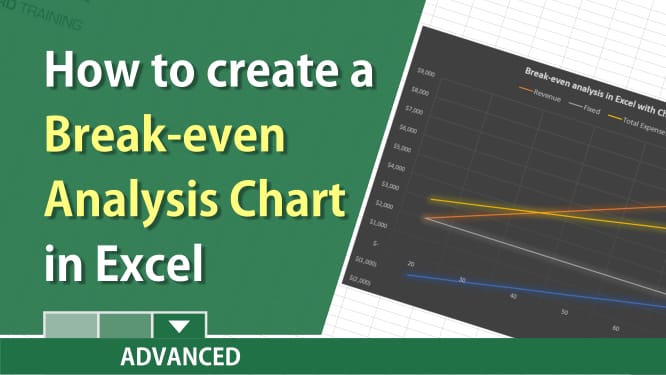
YouTube video on Break-even in Excel with a chart
Break-even analysis in Excel with a chart / cost-volume-profit analysis by Chris Menard