Year-Over-Year Growth - Excel PivotTable


Year-Over-Year (YOY) growth compares one period, usually a quarter or a month, against the same period twelve months before. You can compare Q3 of 2022 against Q3 of 2021. Another example is comparing the month of November 2022 to November 2021.
You can even compare one day to the same day in the previous year. A restaurant may want to compare Mother's Day revenue in one year against Mother's Day during the previous year.
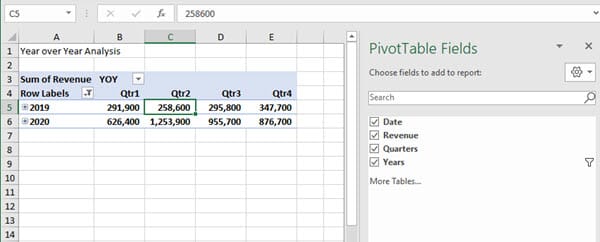
Year-Over-Year in Excel for Quarters
Advantage of Year-Over-Year Analysis
The advantage of Year-Over-Year analysis is it removes the effects of seasons. Two examples:
- Your business revenue rose 15% from May to June. That initially sounds great, but when you examine the previous year in June, revenue rose 30% from the previous month (May). - Suppose sales for June of this year are $10,000, and you think that is great, but when you compare to June of last year, June sales the previous year were $14,000. Sales decreased by 28.5%. This is why year-over-year analysis is a great tool.
List of items you could compare with YOY
1. Revenue 2. Net income or profit 3. Subscribers 4. New customers 5. Expenses 6. Orders
Year-Over-Year YouTube Video
Year-Over-Year analysis in Excel using a PivotTable
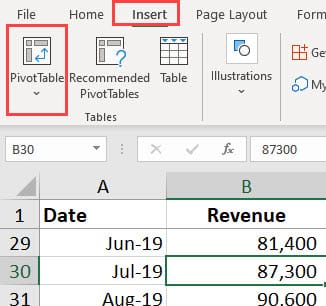
Create a PivotTable in Excel
1. Select the cells you want to create a PivotTable from. 2. Select **Insert** > **PivotTable**.
3. Under **Choose the data that you want to analyze**, select **Select a table or range**. 4. In **Table/Range**, verify the cell range. 5. Under **Choose where you want the PivotTable report to be placed**, select **New worksheet** to place the PivotTable in a new worksheet or **Existing worksheet** and then select the location you want the PivotTable to appear.
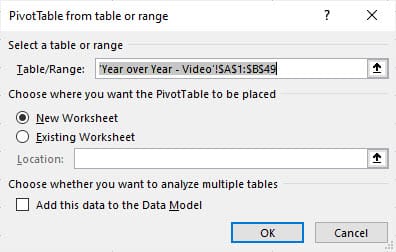
6. Select **OK**.