Use Sparklines in Microsoft Excel

Why use sparklines?
Excel 2010 brought us a new feature called Sparklines. Data presented in a row or column is useful, but patterns can be hard to spot at a glance. The context for these numbers can be provided by inserting sparklines next to the data. Taking up a small amount of room, a sparkline can display a trend based on adjacent data in a clear and compact graphical representation. Although it’s not mandatory for a sparkline cell to be directly next to its underlying data, it is a good practice.
You can quickly see the relationship between a sparkline and its underlying data, and when your data changes you can see the change in the sparkline immediately. In addition to creating a single sparkline for a row or column of data, you can create several sparklines at the same time by selecting multiple cells that correspond to underlying data, as shown in the following picture.
Sparklines in Microsoft Excel by Chris Menard - YouTube
Create a Sparkline
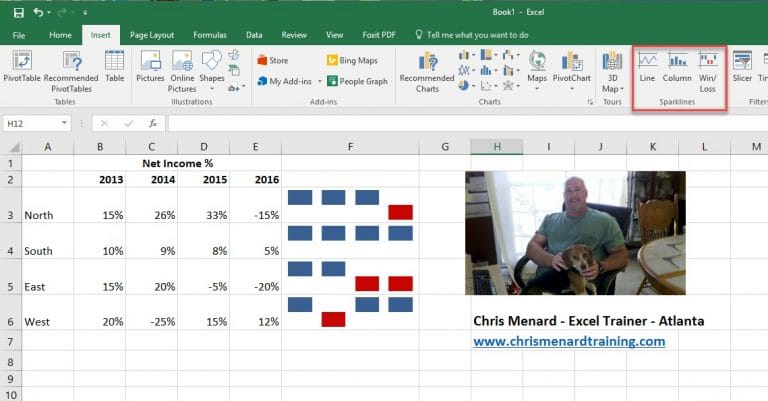
1. Select an empty cell or group of empty cells in which you want to insert one or more sparklines. 2. On the **Insert** tab, in the **Sparklines** group, click the type of sparkline that you want to create: **Line**, **Column**, or **Win/Loss**. 3. In the **Data** box, type the range of the cells that contain the data on which you want to base the sparklines.