Financial Ratios - Formula Completion in Excel using Copilot

Writing formulas in Excel can be time-consuming and challenging, even for experienced users. Selecting the right function, referencing the correct cells, and ensuring proper syntax often slows down workflows and leads to errors. Many users spend extra time troubleshooting mistakes, searching for examples, or trying to recall the exact formula structure.
Formula completion in Excel, powered by advanced AI, solves these challenges by suggesting and autocompleting formulas as soon as you type “=”. I’m using this feature to quickly calculate financial ratios from income statements and balance sheets, making the process faster and more accurate. With formula completion, you can create precise formulas confidently and focus on analyzing your data and insights rather than worrying about syntax.
Note: Microsoft 365 Copilot license required for Formula Completion
Balance Sheet Ratios
Two balance sheet ratios I tested are the current ratio and the quick ratio. Both ratios are measures of a company's short-term liquidity, but they differ in what assets they include:
1. Current Ratio
- Formula: Current Assets/Current Liabilities
- Current Assets include:
- Cash and cash equivalents
- Accounts receivable
- Inventory
- Prepaid expenses
- Purpose:
Shows how well a company can cover its short-term obligations with all current assets. - Interpretation:
A 2:1 often indicates good liquidity, but this varies by industry.
YouTube Video - Formula Completion with Financial Ratios
2. Quick Ratio (Acid-Test Ratio)
- Formula: Quick Assets/Current Liabilities
- Quick Assets = Current Assets minus Inventory and Prepaid Expenses (because these are less liquid).
- Includes:
- Cash and cash equivalents
- Marketable securities
- Accounts receivable
- Includes:
- Purpose:
Measures the ability to pay short-term obligations without relying on inventory. - Interpretation:
A ratio of 1:1 is generally considered healthy.
Key Difference
- Current Ratio considers all current assets (including inventory).
- Quick Ratio excludes inventory and prepaid expenses for a stricter liquidity test.
Excel File download
Income Statement Ratios
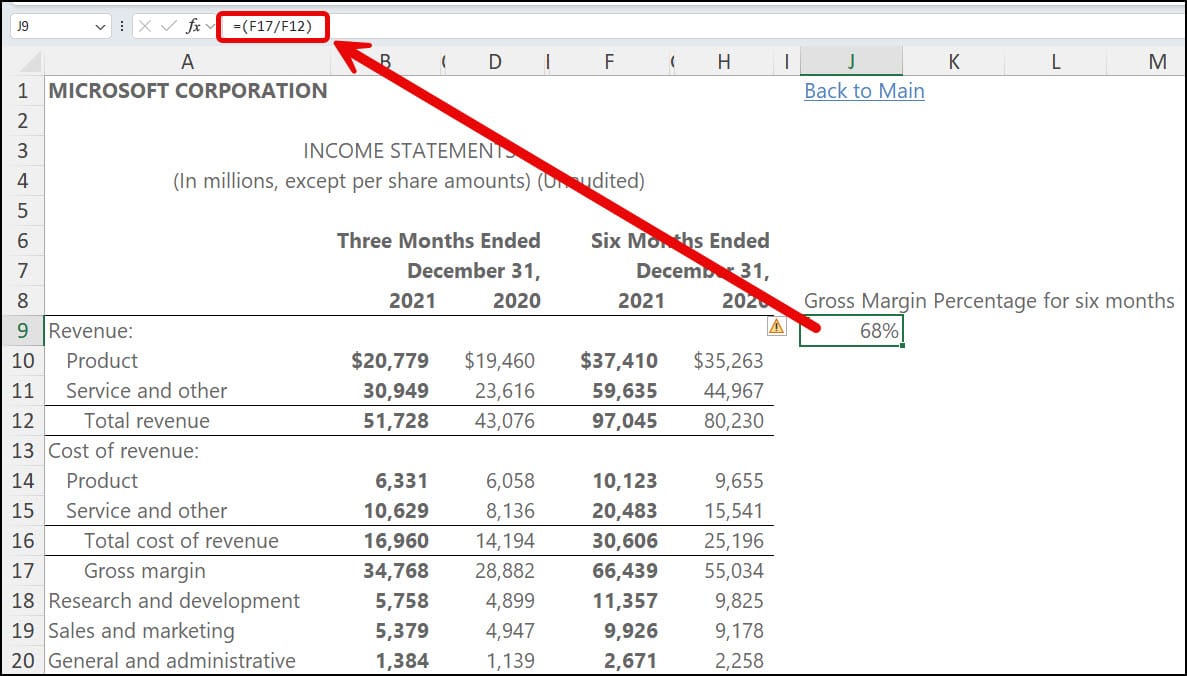
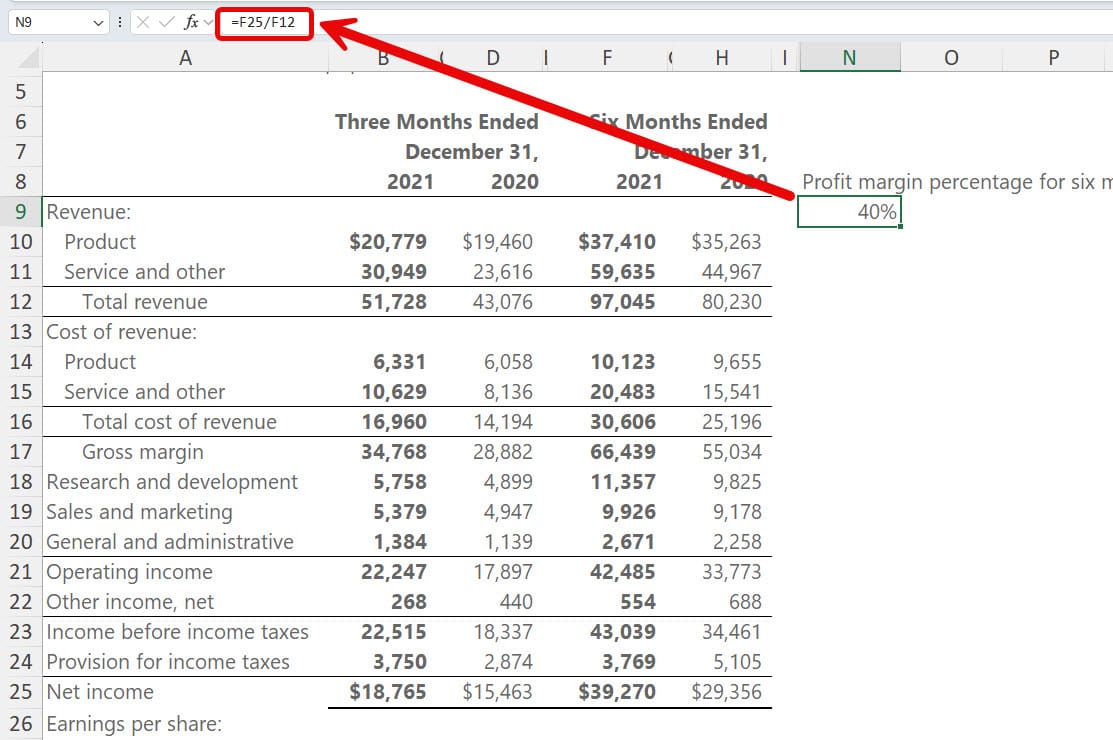
Gross margin and profit margin are key indicators of a company’s financial health, but they measure different aspects of profitability. Gross margin shows how much revenue remains after covering the cost of goods sold, highlighting production efficiency and pricing strategy. Profit margin, on the other hand, reflects the percentage of revenue that turns into actual profit after accounting for all expenses, including operating costs, taxes, and interest. Together, these metrics provide a clear picture of both operational performance and overall profitability.
1. Gross Margin Percentage
- Formula: (Revenue-Cost of Goods Sold)/Revenue
- Focus:
Measures how much of each dollar of revenue is left after covering direct production costs (COGS). - Includes:
- Revenue
- COGS (materials, labor directly tied to production)
- Excludes:
Operating expenses, taxes, interest. - Purpose:
Indicates production efficiency and pricing strategy. - Example:
If revenue = $100, COGS = $60. The Gross Margin is 40%. (100-60)/100 = 40%

2. Profit Margin Percentage
- Formula: Net Income/Revenue
- Focus:
Shows how much of each dollar of revenue becomes actual profit after all expenses. - Includes:
- Operating expenses
- Taxes
- Interest
- Depreciation
- Purpose:
Reflects overall profitability and cost control. - Example:
If revenue = $100, net income = $10. Profit Marin is 10%. 10/100=.10 or 10%

Key Differences in Gross Margin and Profit Margin
| Aspect | Gross Margin | Profit Margin |
|---|---|---|
| Focus | Production efficiency | Overall profitability |
| Costs Included | Only COGS | All expenses |
| Benchmark | Higher = better | Higher = better |


