Breakeven Analysis - Breakeven in Units and Breakeven in Sales
Posted on: 05/08/2023
Cost-Volume-Profit (CVP) analysis provides insights into how variations in both variable and fixed costs impact a company’s profitability. By examining the relationships between sales volume, costs, and revenue, CVP analysis helps organizations make informed decisions about pricing, production levels, and overall financial performance.
The Contribution Margin is a company's revenue minus its variable costs. You can use it to find the Breakeven Point, which is where you aren't making any profit or loss—your net is zero. Another way of looking at the contribution margin is the amount per unit to cover fixed costs. The Contribution Margin formula is Net Sales Revenue—variable Costs = Contribution Margin.
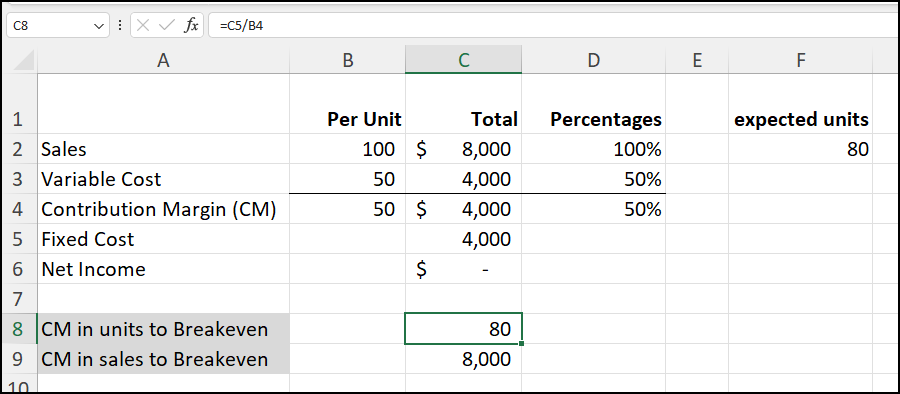
Breakeven Analysis Chart - Multiple Products
YouTube Video - Breakeven in Units and Breakeven in Sales
Breakeven Formulas
-
Breakeven in Units is the Fixed Cost / Contribution Margin per unit
-
Breakeven in Sales is the Fixed Cost / Contribution Margin percentage
A few online courses by Chris Menard
Copilot is being developed, so it is at a bargain price. The entire course will be ready in mid-May. Copilot for M365 works in Word, Excel, PowerPoint, OneNote, Outlook, and Teams. Coming soon to OneDrive and Forms.
All courses are at https://courses.chrismenardtraining.com
Recent Articles
Microsoft Word to Adobe Acrobat with Bookmarks
We don't usually want to email, or share are Word files. Frequently, we make our Word documents PDF files. If you lay out your Word document correctly, it is easy to make bookmarks in the PDF.
Mastering Excel Slicers: A Comprehensive Guide
Excel slicers are powerful tools that enhance data filtering in Microsoft Excel, making it easier to visualize and analyze your data. In this blog, we will explore how to create and effectively use slicers, as well as their advantages and limitations in comparison to traditional filters.
Analyzing 50+ Years of Mortgage Rates in Excel: Insights and Trends
Understanding mortgage rates is crucial for anyone looking to buy a home or refinance their existing mortgage. In this comprehensive analysis, we'll dive deep into over 50 years of mortgage rate data using Microsoft Excel. We'll explore historical trends, calculate key statistics, and examine how changes in interest rates impact monthly payments.
Chris Menard
Chris Menard is a Microsoft Trainer (MCT) and works as a full-time Trainer at BakerHostetler - one of the largest law firms in the US. Chris runs a YouTube channel with 900+ technology videos that cover various tools such as Excel, Word, Zoom, Teams, Gmail, Copilot, Google Calendar, and Outlook. To date, the channel has helped over 20 million viewers.
Menard also does 2 to 3 public speaking events yearly, presenting at the Administrative Professional Conference (APC), the EA Ignite Conference, the University of Georgia, and CPA conferences. You can connect with him on LinkedIn at https://chrismenardtraining.com/linkedin or watch his videos on YouTube at https://chrismenardtraining.com/youtube.
Categories