Create a treemap in Excel to spot patterns

Why use a treemap in Excel?
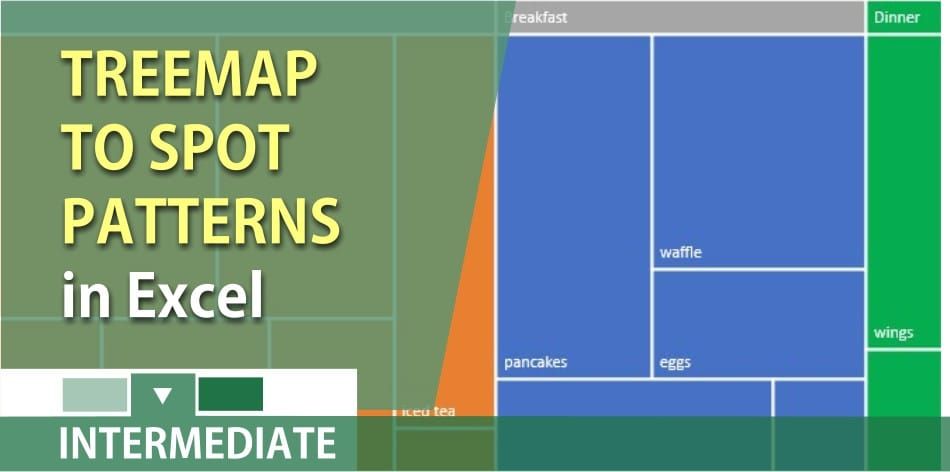
A treemap chart provides a hierarchical view of your data and makes it easy to spot patterns, such as which items are a store’s best sellers. The tree branches are represented by rectangles and each sub-branch is shown as a smaller rectangle. The treemap chart displays categories by color and proximity and can easily show lots of data which would be difficult with other chart types. The treemap chart displays categories by color and proximity and can easily show lots of data which would be difficult with other chart types.
Video of creating a treemap
Create a treemap in Excel 2016 by Chris Menard - YouTube